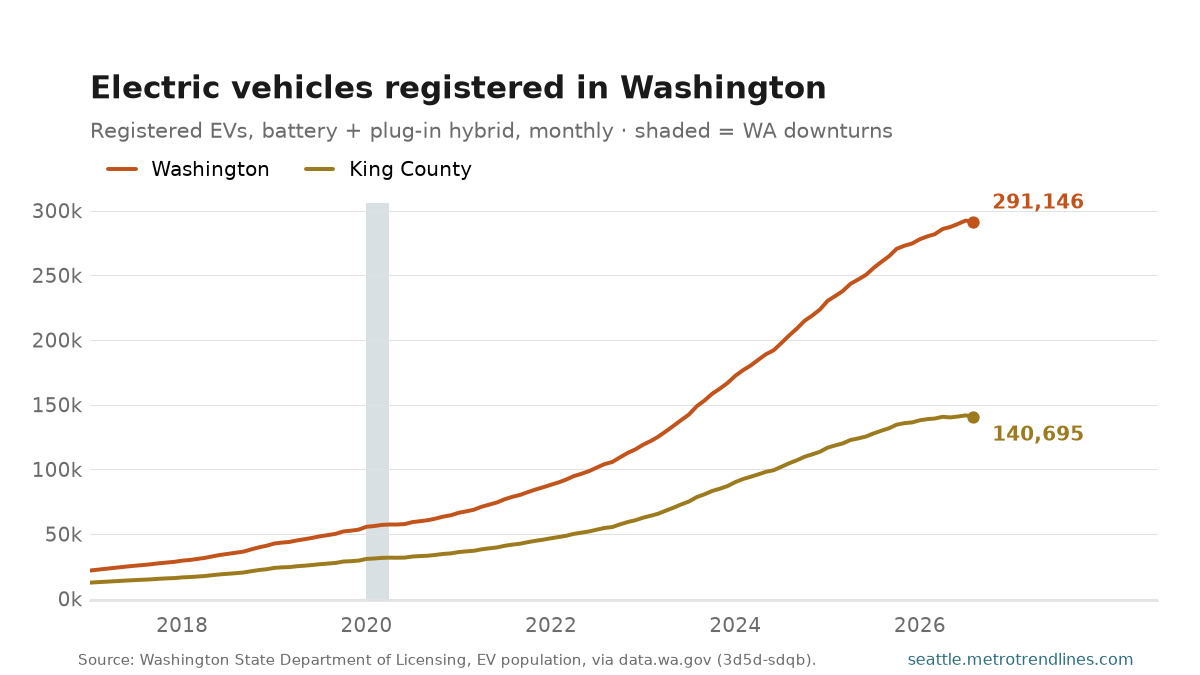
291,146 electric vehicles were registered in Washington in August 2026, up 11.8% from a year earlier. King County holds 140,695 of them — 48% of the state’s fleet, in a county with about a third of its people.
This is a stock, not sales: it counts the EVs registered and on the road in that month, so it falls only when cars leave the fleet faster than they join it. That makes the slope, rather than the level, the thing to read — a flattening line means adoption slowing, not the fleet shrinking.
Battery-electric and plug-in hybrid vehicles are both counted here; the mix between them is its own post, and the two have not grown at the same rate.
Source: Washington State Department of Licensing, Electric Vehicle Population, via data.wa.gov (Socrata 3d5d-sdqb). Counts vehicles registered in the month, not sales. Auto-generated each build.
What’s coming on seattle.metrotrendlines.com the week of October 12–16 — 11 posts on the calendar.
Monday, October 12 — King County Metro bus ridership, August 2026; Seattle’s air, June 2026 (pending — its numbers haven’t landed yet).
Tuesday, October 13 — Seattle offences against persons, August 2026; Seattle offences against property, August 2026.
Wednesday, October 14 — Sounder commuter rail, August 2026; Washington State Ferries ridership, August 2026.
Thursday, October 15 — Washington business applications, August 2026; Seattle’s crime rate, August 2026.
Friday, October 16 — Washington jobless claims, week of Oct 3, 2026 (pending — its numbers haven’t landed yet); Seattle gas prices, August 2026 (pending — its numbers haven’t landed yet); King County’s share of Washington’s EVs, August 2026.
This is the plan, not a promise. Every weekday post here is tied to a data release, and a release that slips takes its post with it — the post simply waits for the day its numbers land. A figure that arrives early, a revision worth writing about, or an unexpected story out of Seattle can just as easily add a post that isn’t on this list. Expect the week to look roughly like this, and expect at least one day of it not to.
The week of October 5–9 on seattle.metrotrendlines.com, in 10 posts.
Monday, October 5 — King County for-sale inventory, September 2026. King County ended September 2026 with 7,611 active for-sale listings, up 29.1% from a year earlier — the monthly update to King County’s inventory rebuild.
Monday, October 5 — Sea-Tac against normal, September 2026. September 2026 at Sea-Tac ran 1.6°F below normal. Normal here is the 1991-2020 average for that same month, which is the standard climate baseline — so this is a comparison with the recent past, not with the start of the record.
Tuesday, October 6 — King County asking prices, September 2026. The median King County listing asked $842,425 in September 2026, down 0.9% from a year earlier.
Tuesday, October 6 — What King County sellers listed, September 2026. King County sellers put 2,782 new listings on the market in September 2026, down 8.5% from the same month a year earlier.
Wednesday, October 7 — How long a King County listing sits, September 2026. The median King County listing sat 50 days on the market in September 2026, against 46 days a year earlier.
Wednesday, October 7 — King County homes under contract, September 2026. 1,948 King County listings were under contract at the end of September 2026, down 17.7% from a year earlier.
Thursday, October 8 — Seattle’s labor force, August 2026. The Seattle–Tacoma–Bellevue labor force — everyone employed or actively looking for work — was 2,300,841 in August 2026, down 0.3% from a year earlier.
Thursday, October 8 — Seattle-metro unemployment, August 2026. Seattle-metro unemployment was 4.8% in August 2026, the newest month in the series and the monthly update to the unemployment post. That is up 0.0 points from 4.8% in the same month a year earlier, and down from 5.0% the month before.
Friday, October 9 — Link light rail ridership, August 2026. Link carried 5,015,697 boardings in August 2026, up 38.6% from a year earlier. The record month is 5,205,705 (July 2026); today’s figure is 4% below it.
Friday, October 9 — Washington jobless claims, week of Oct 3, 2026. Washington workers filed 4,788 initial unemployment claims in the week ending Oct 3, 2026; the steadier four-week average is 4,684, down 17.4% from the same weeks a year ago. Read the chart in two parts.
The week in review: every post from October 5–9, summarised from its own listing blurb and linked. Assembled each Saturday from the posts that actually published that week.
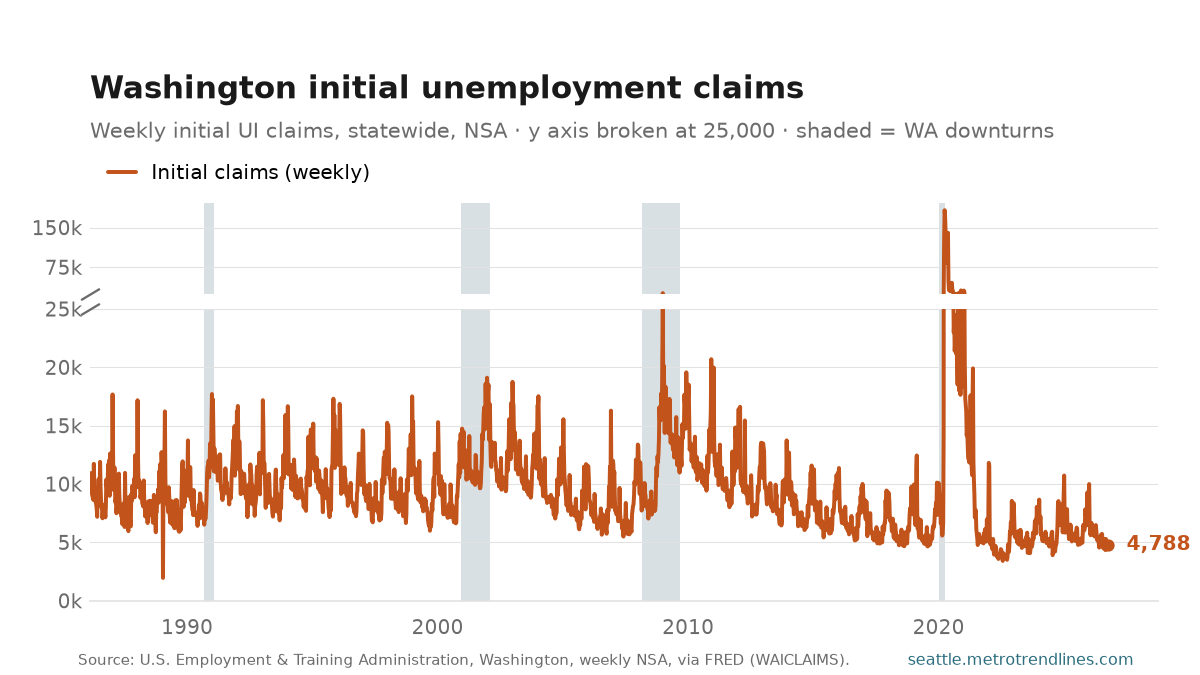
Washington workers filed 4,788 initial unemployment claims in the week ending Oct 3, 2026; the steadier four-week average is 4,684, down 17.4% from the same weeks a year ago.
Read the chart in two parts. The y axis is broken at 25,000. Below the break is where this series lives: almost every week since 1986 is in that band, and on its own scale the normal shape is plain — a spike every winter as construction and seasonal retail lay off, and a sustained rise through 2008-09. Above the break, on a compressed scale, is the spring of 2020, when claims reached 182,849 in the week of Mar 28, 2020. On a single axis that one episode flattens 40 years into a line along the floor.
Claims are the fastest labour-market number there is — a week old when published — and the noisiest. One week is a data point; the four-week average is the reading. Statewide, not seasonally adjusted, so compare with the same weeks a year earlier rather than the week before. The original post is here.
Source: U.S. Employment and Training Administration, initial unemployment-insurance claims for Washington, weekly, not seasonally adjusted, via FRED WAICLAIMS. Auto-generated each build.
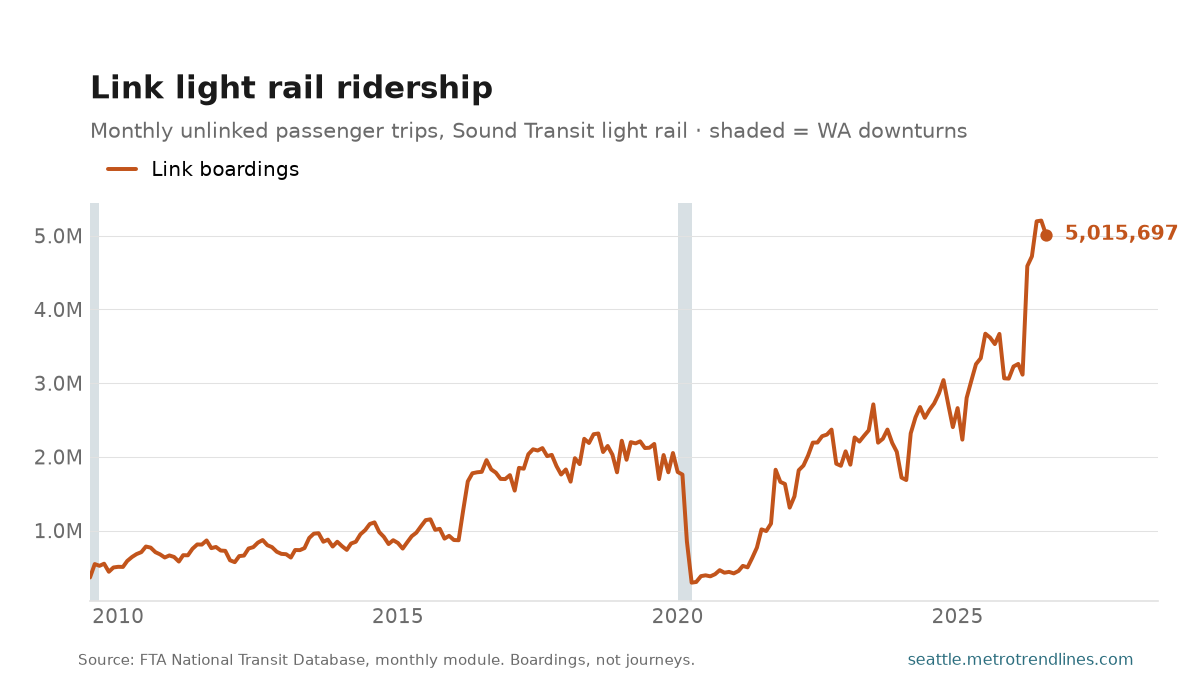
Link carried 5,015,697 boardings in August 2026, up 38.6% from a year earlier. The record month is 5,205,705 (July 2026); today’s figure is 4% below it.
Link is the one Seattle transit number that is not really about the economy: the line keeps getting longer. Extensions to Northgate, the Eastside and Lynnwood each added stations and riders, so a rise here is partly more people riding and partly more railway to ride — which is why the year-over-year comparison matters more than the level, and why a step up in the line usually has an opening date behind it rather than a change in behaviour.
These are boardings, not journeys or people. A trip with a transfer counts twice, so a network that adds a transfer point reports more ridership from the same riders. The figures are Sound Transit’s own submissions to the federal National Transit Database, which is what makes them comparable with the bus and ferry numbers here; the agency’s public tracker uses a slightly different basis and will not always match. Not seasonally adjusted.
The chart starts at the July 2009 opening of Central Link. Sound Transit reported light-rail boardings to the NTD for six years before that, but they are Tacoma’s line — a separate 1.6-mile route at the other end of the corridor, running in the tens of thousands a month — and drawn beside Seattle’s millions they would read as a railway that did not exist yet.
Source: Federal Transit Administration, National Transit Database monthly module, Sound Transit light rail unlinked passenger trips, from the July 2009 opening of Central Link. Auto-generated each build.
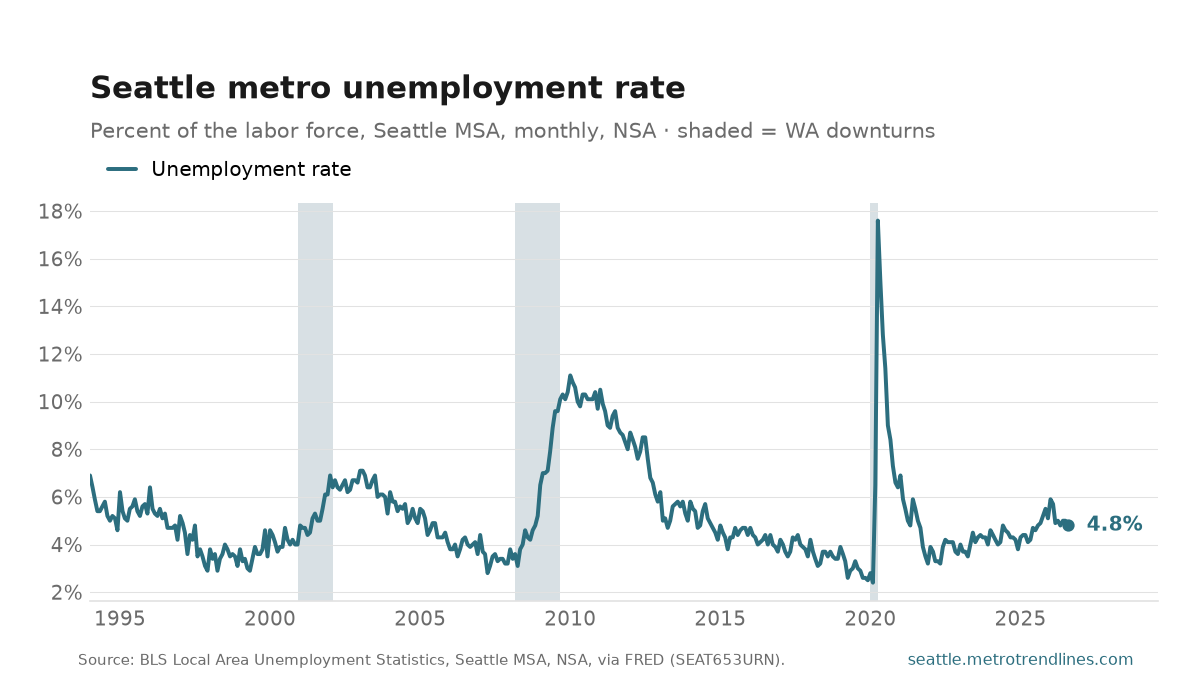
Seattle-metro unemployment was 4.8% in August 2026, the newest month in the series and the monthly update to the unemployment post. That is up 0.0 points from 4.8% in the same month a year earlier, and down from 5.0% the month before. The chart carries the full history back to 1994; the older post’s version of it stops at the month it was published with, so the two lines end in different places on purpose.
The year-ago comparison is the one to trust here. These numbers are not seasonally adjusted, so part of every month-to-month move is just the calendar — hiring for the holidays, students leaving and re-entering the labor force — and only the same month a year earlier strips that out. Keep the scale in mind too: this series ran from 2.4% in February 2020 to 17.6% in April 2020, so a few tenths of a point is a wobble, not a turn. And because the rate is a ratio, it can fall for the wrong reason — people who stop looking for work leave the denominator, and the rate improves with nobody hired.
Source: U.S. Bureau of Labor Statistics, Local Area Unemployment Statistics, Seattle–Tacoma–Bellevue MSA unemployment rate, not seasonally adjusted, via FRED SEAT653URN. Auto-generated each build.
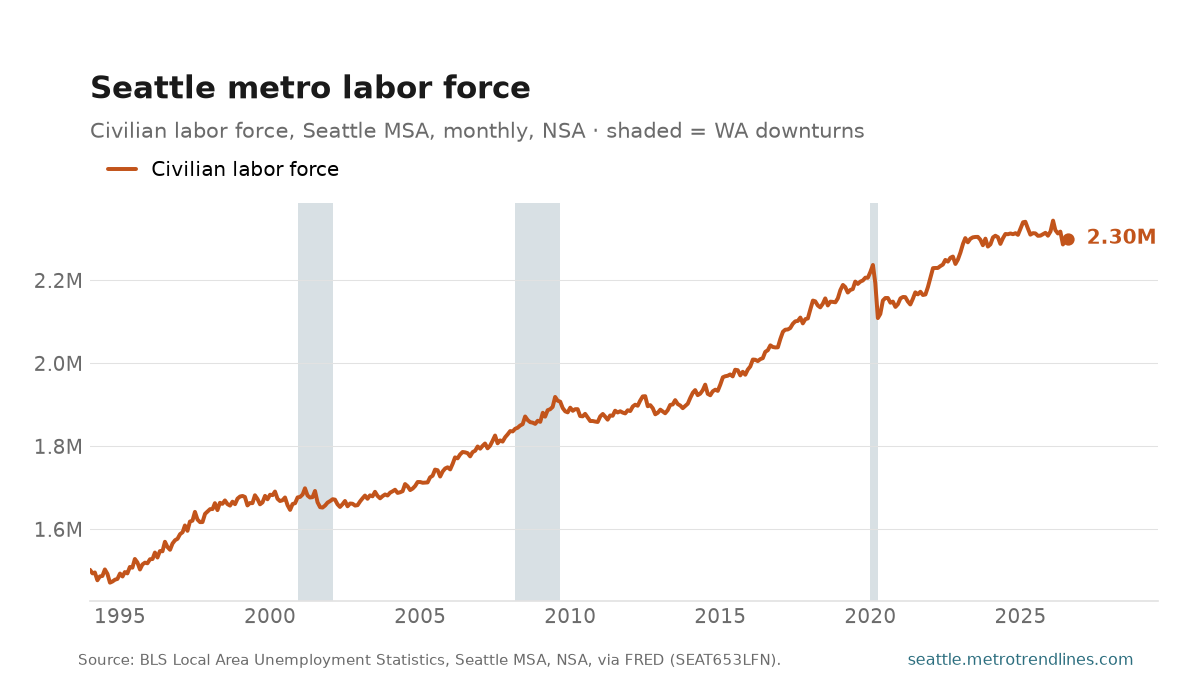
The Seattle–Tacoma–Bellevue labor force — everyone employed or actively looking for work — was 2,300,841 in August 2026, down 0.3% from a year earlier. It’s the head-count denominator under the unemployment rate: a labor force that grows with population and participation. Not seasonally adjusted.
Source: U.S. Bureau of Labor Statistics, Local Area Unemployment Statistics, Seattle–Tacoma–Bellevue MSA civilian labor force, not seasonally adjusted, via FRED SEAT653LFN. Auto-generated each build.
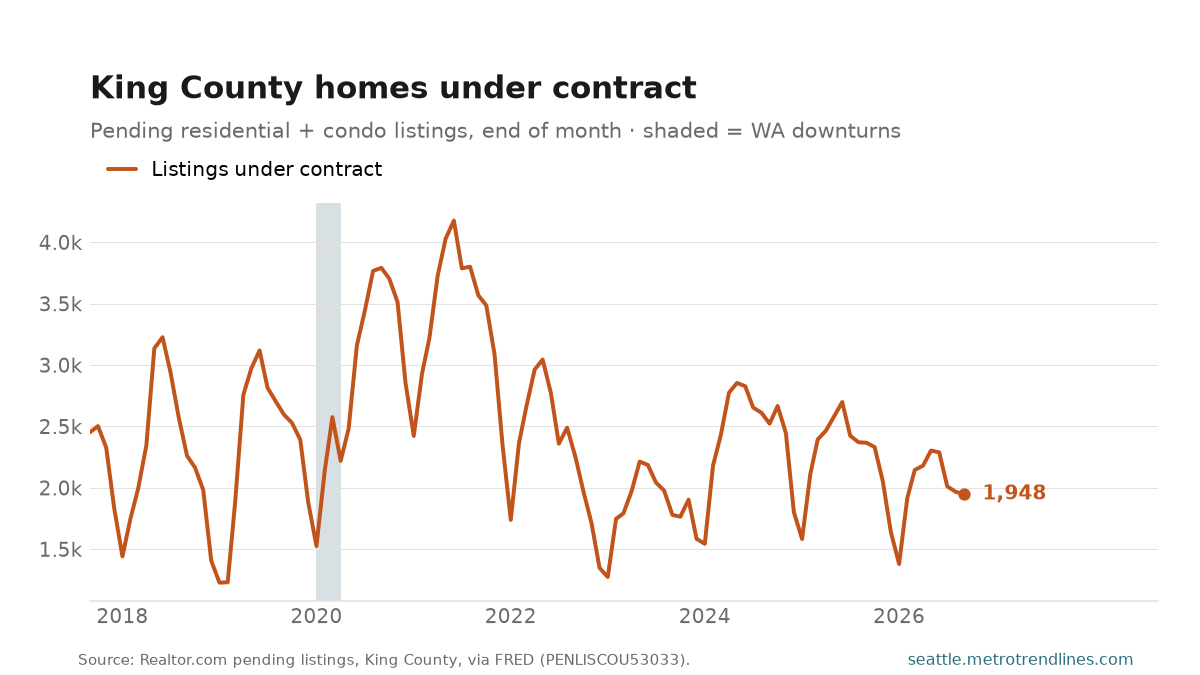
1,948 King County listings were under contract at the end of September 2026, down 17.7% from a year earlier. Pending sales are the closest thing this site carries to a leading indicator of the housing market: a deal goes pending weeks before it closes, so this line turns before recorded sale prices do.
It is also the demand side of the same monthly Realtor.com drop that gives us inventory and asking prices. Inventory rising while pendings fall is a market cooling; both rising together is just a busy spring.
Source: Realtor.com pending residential listings, King County WA, via FRED PENLISCOU53033. Auto-generated each build.
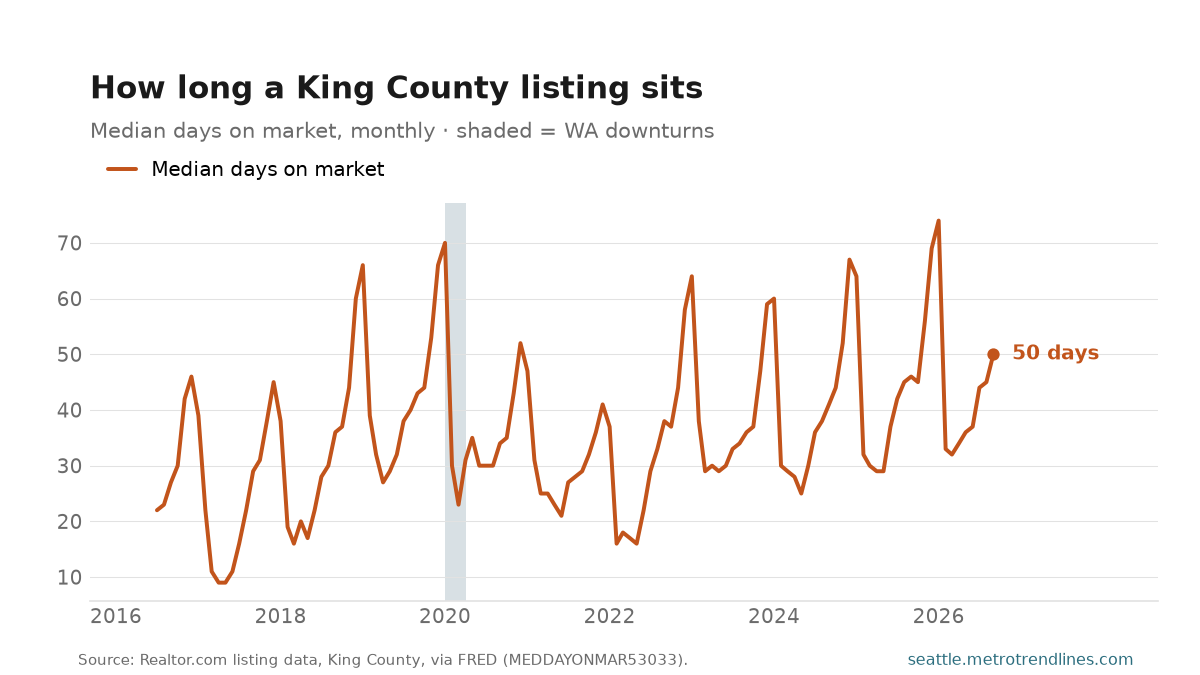
The median King County listing sat 50 days on the market in September 2026, against 46 days a year earlier. Days on market is the market’s pulse rather than its price: it says how long sellers wait, and it moves before asking prices do, because a seller cuts the price only after the waiting has already happened.
The seasonal pattern is severe and it is not a trend — listings move fastest in spring and slowest in December, every year, and the only honest comparison is to the same month a year ago. Over the whole series the fastest month was 9 days (April 2017) and the slowest 74 (January 2026).
Source: Realtor.com median days on market, King County WA, via FRED MEDDAYONMAR53033. Auto-generated each build.
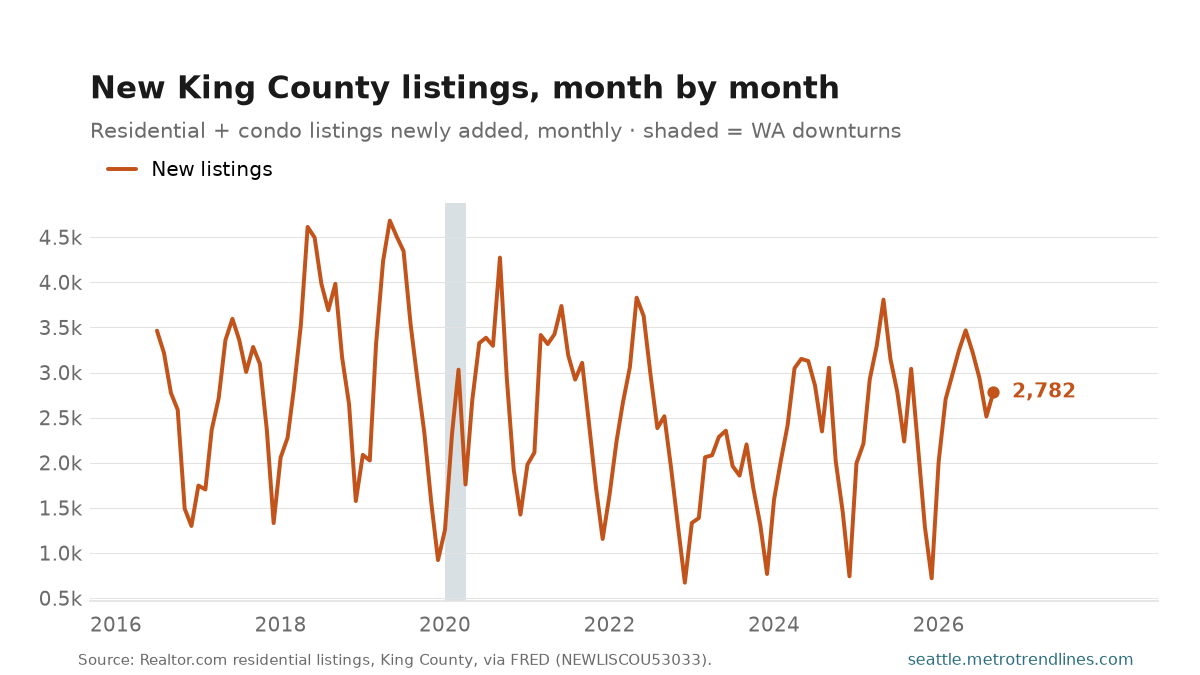
King County sellers put 2,782 new listings on the market in September 2026, down 8.5% from the same month a year earlier. The year-over-year comparison is the only fair one here: this series has a spring peak and a December trough every single year, so a fall from June to November says nothing except that it got dark.
New listings are the supply side of the inventory number — what sellers add, rather than what is sitting unsold. The two move apart when demand shifts: inventory can climb on flat new listings if buyers stop absorbing them.
Source: Realtor.com new residential listings, King County WA, via FRED NEWLISCOU53033. Auto-generated each build.