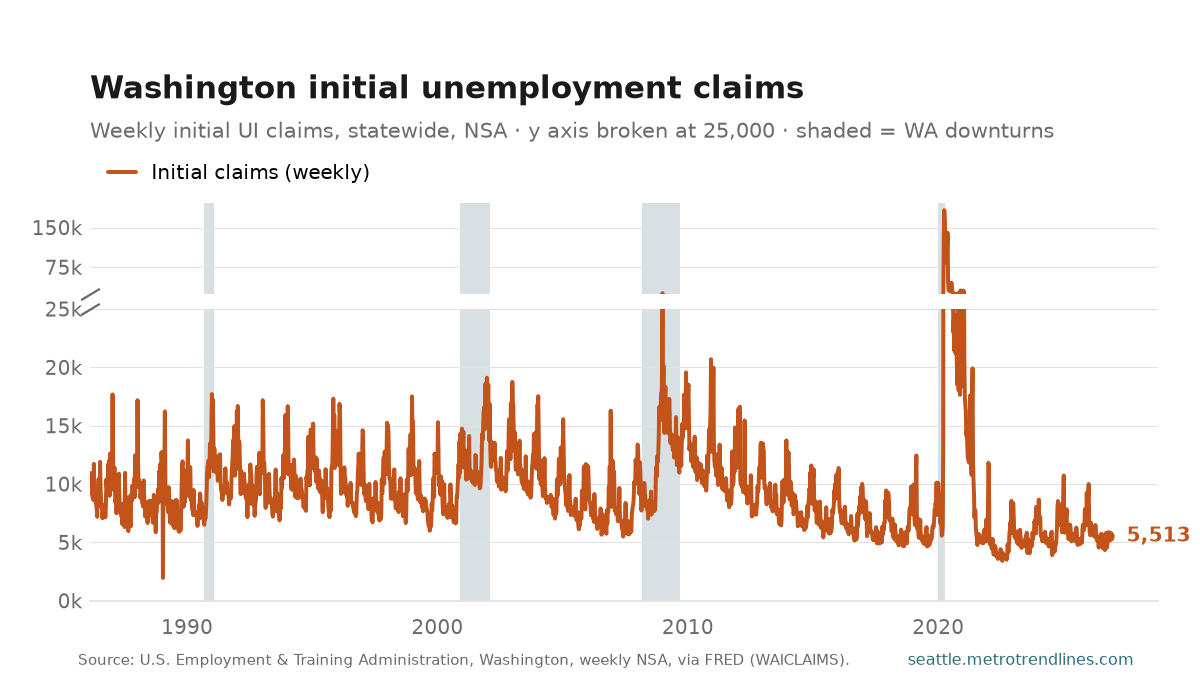
Washington workers filed 5,513 initial unemployment claims in the week ending Oct 10, 2026; the steadier four-week average is 4,870, down 18.0% from the same weeks a year ago.
Read the chart in two parts. The y axis is broken at 25,000. Below the break is where this series lives: almost every week since 1986 is in that band, and on its own scale the normal shape is plain — a spike every winter as construction and seasonal retail lay off, and a sustained rise through 2008-09. Above the break, on a compressed scale, is the spring of 2020, when claims reached 182,849 in the week of Mar 28, 2020. On a single axis that one episode flattens 40 years into a line along the floor.
Claims are the fastest labour-market number there is — a week old when published — and the noisiest. One week is a data point; the four-week average is the reading. Statewide, not seasonally adjusted, so compare with the same weeks a year earlier rather than the week before. The original post is here.
Source: U.S. Employment and Training Administration, initial unemployment-insurance claims for Washington, weekly, not seasonally adjusted, via FRED WAICLAIMS. Auto-generated each build.
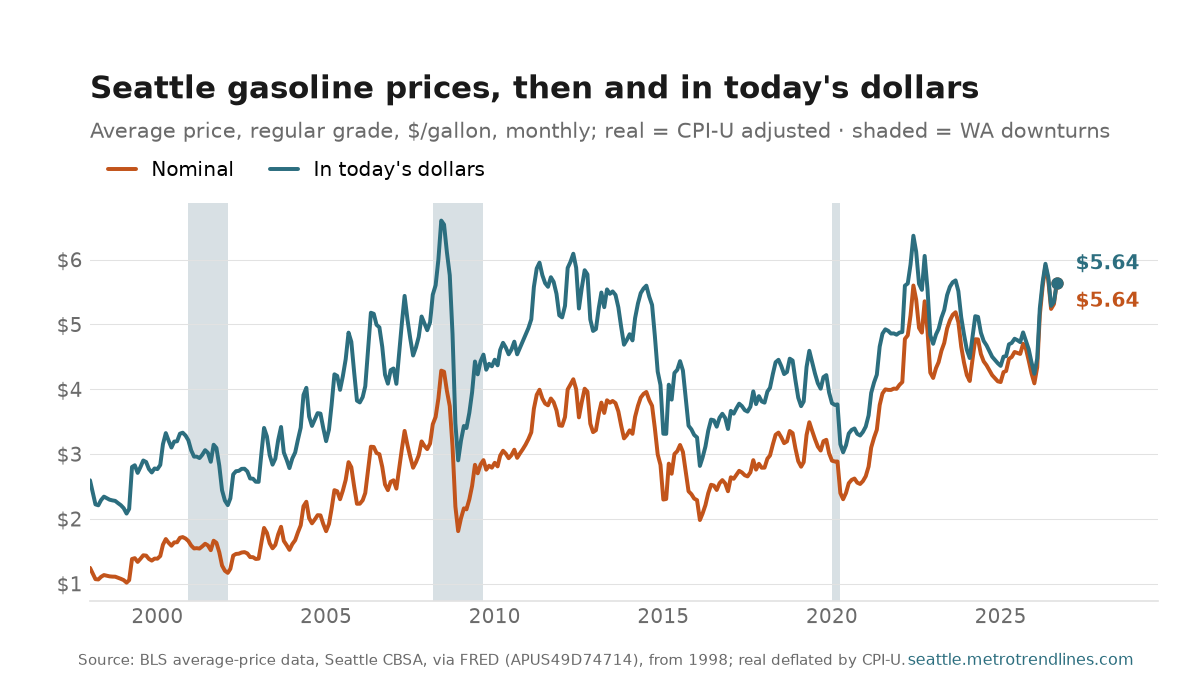
The Seattle-area average price of regular gasoline was $5.64 a gallon in September 2026, up 20.0% from a year earlier. After inflation the change is up 15.7% — a year-ago gallon cost $4.88 in today’s money.
Two lines, one chart. The orange line is what the pump said at the time. The teal line restates every past price in September 2026 dollars, so the two meet at the right-hand end by construction, and the gap between them further left is inflation. Measured in today’s dollars the record is $6.60 in June 2008; the nominal record is $5.90 in May 2026. Only the real line can answer whether filling the tank costs more than it used to — the nominal one sets a new high every time the dollar shrinks.
Deflated by the national CPI-U, so “today’s dollars” means the latest month the price index covers. State fuel taxes and the clean-fuel standard are inside the number: this is what drivers paid, not what the crude cost. The lines start in January 1998, where BLS resumed collecting a Seattle price after roughly a decade of not publishing one.
Source: U.S. Bureau of Labor Statistics average-price series, regular unleaded gasoline, Seattle CBSA, via FRED APUS49D74714; real series deflated by CPI-U to the latest available month. Auto-generated each build.
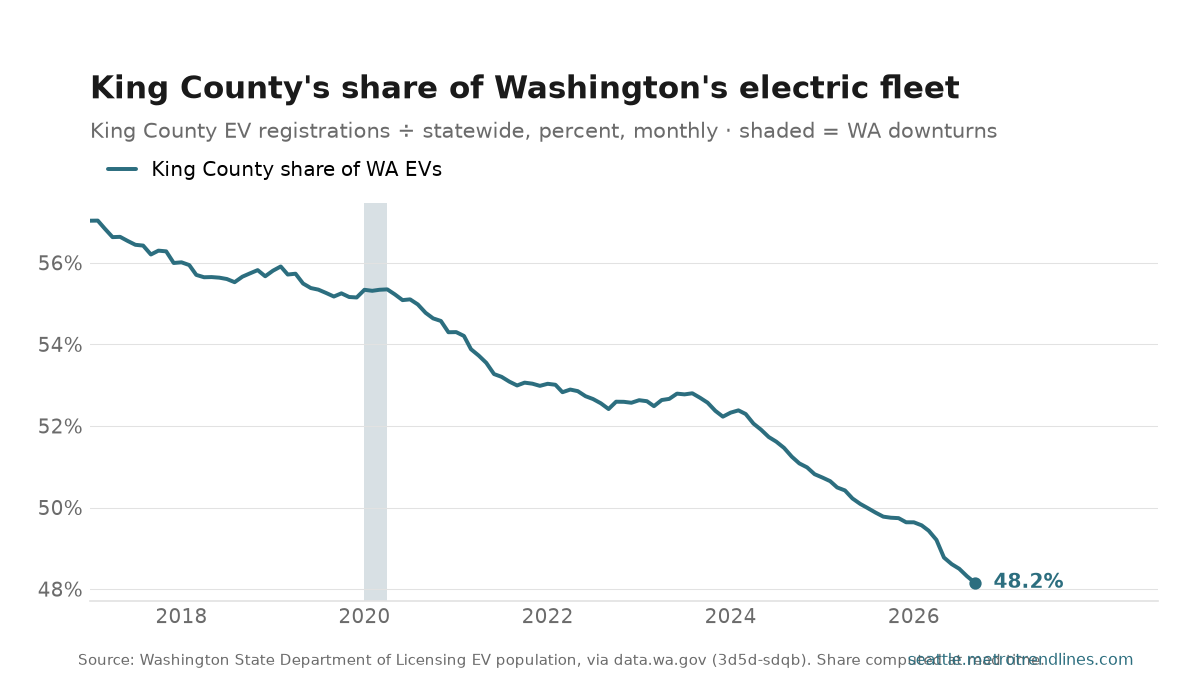
48.2% of Washington’s electric vehicles were registered in King County in September 2026 — 140,379 of the state’s 291,499. The share was 57.0% at its height, in February 2017.
A falling share on a rising count is the interesting shape, and it is what this chart shows: King County has more electric cars every month and a smaller slice of the state’s every month. Early adoption was concentrated here — one county held more than half the state’s EVs — and the rest of Washington has been catching up ever since. The story of EV adoption is now happening outside Seattle.
A share of a whole rather than a rate: numerator and denominator are the same Department of Licensing release, so the figure is exact. Note it is not a per-capita measure — King County holds about a third of the state’s people, so a share near half still means EVs are over-represented here.
Source: Washington State Department of Licensing, Electric Vehicle Population, via data.wa.gov (Socrata 3d5d-sdqb). The share is derived at read time from the county and statewide series. Auto-generated each build.
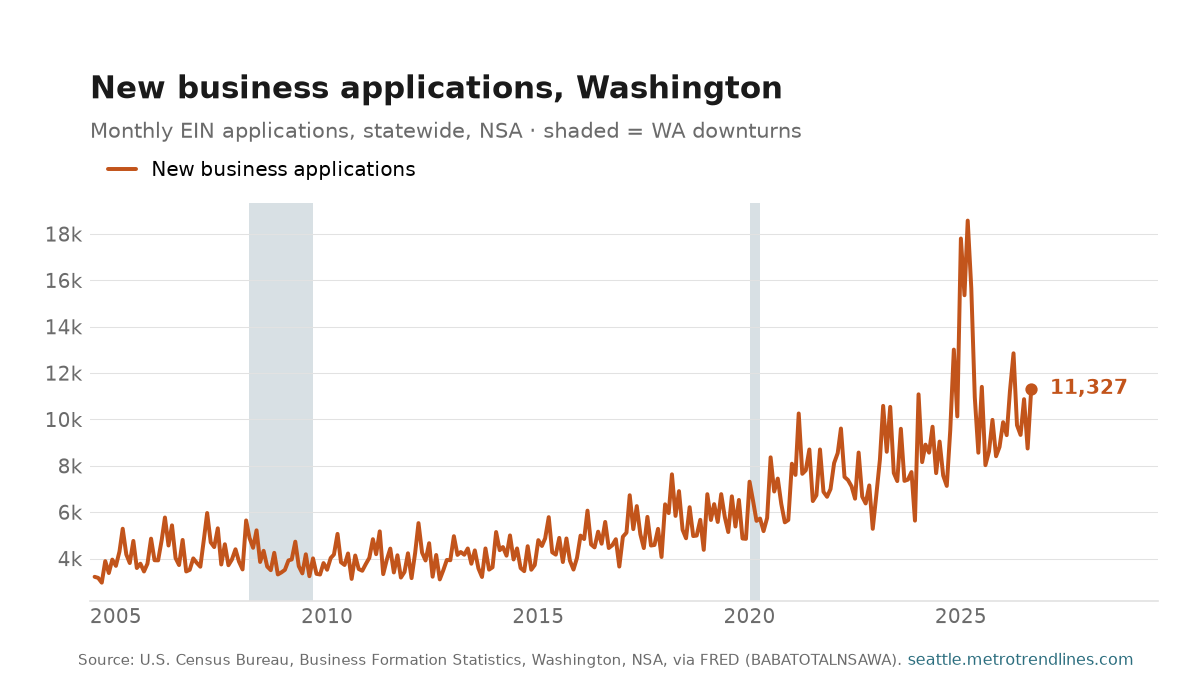
Washingtonians filed 11,327 new business applications in September 2026, up 31.4% from a year earlier. These are EIN filings, so the series measures intent to start a business rather than businesses that actually open — but it lands about 11 days after the month ends, which makes it one of the fastest real-activity readings available for the state. Note the step-change after 2020: application rates never returned to their pre-pandemic level.
Source: U.S. Census Bureau, Business Formation Statistics, business applications for Washington, monthly, not seasonally adjusted, via FRED BABATOTALNSAWA. Auto-generated each build.
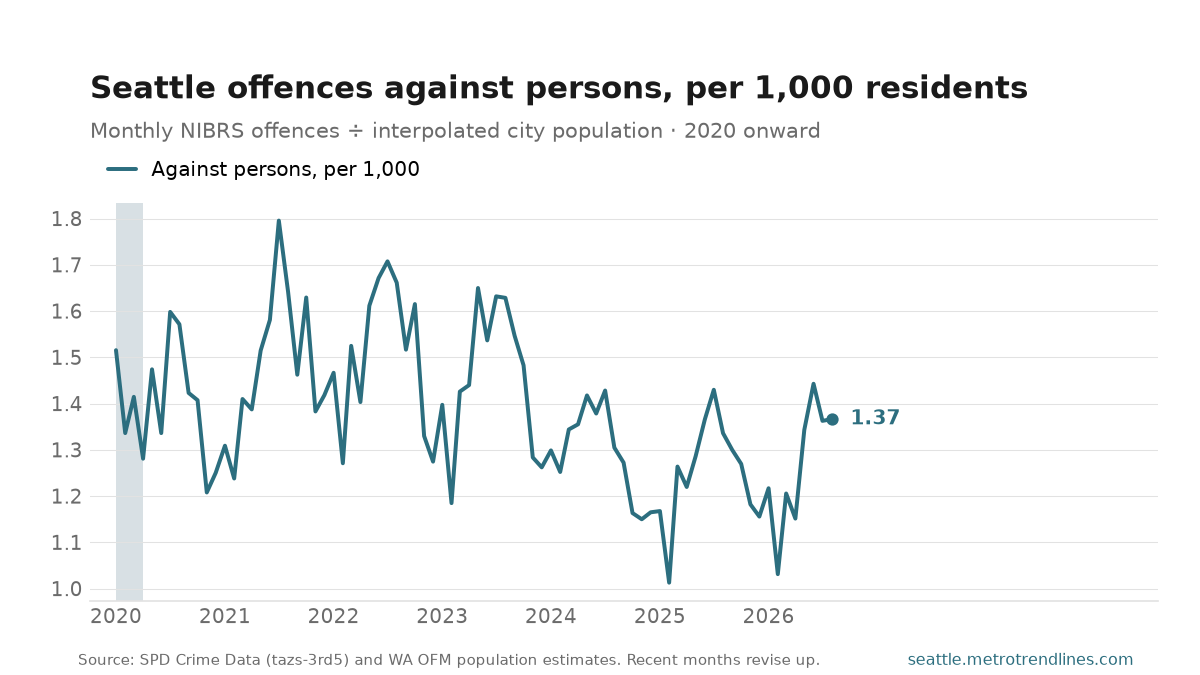
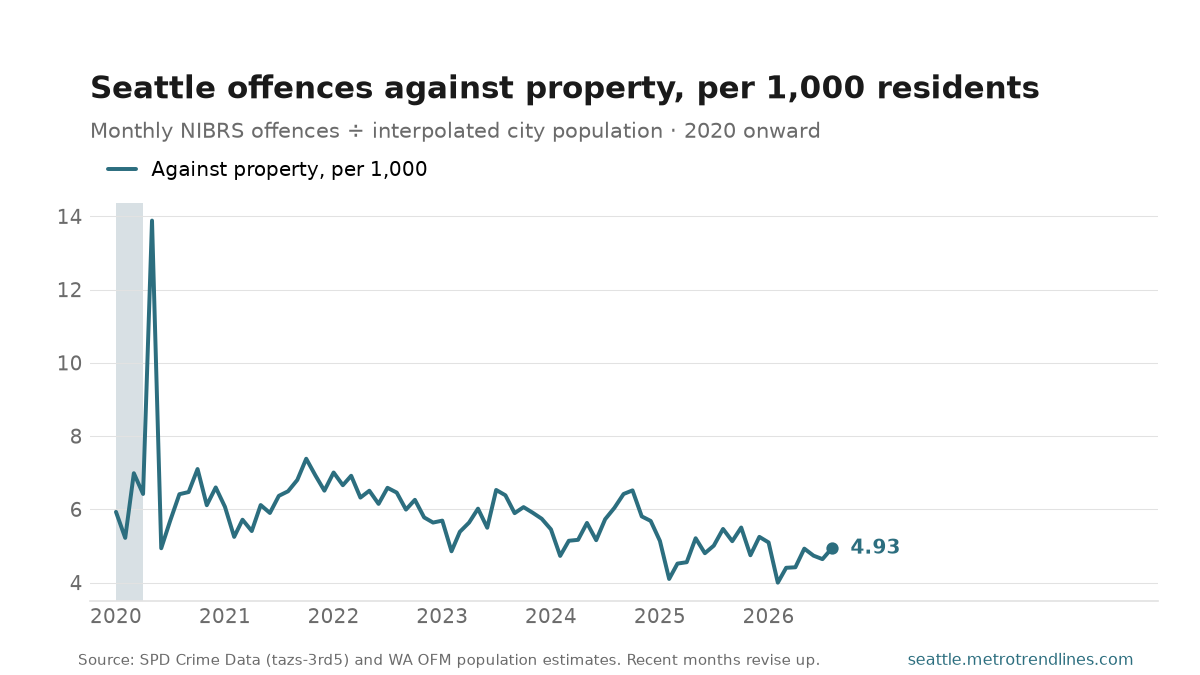
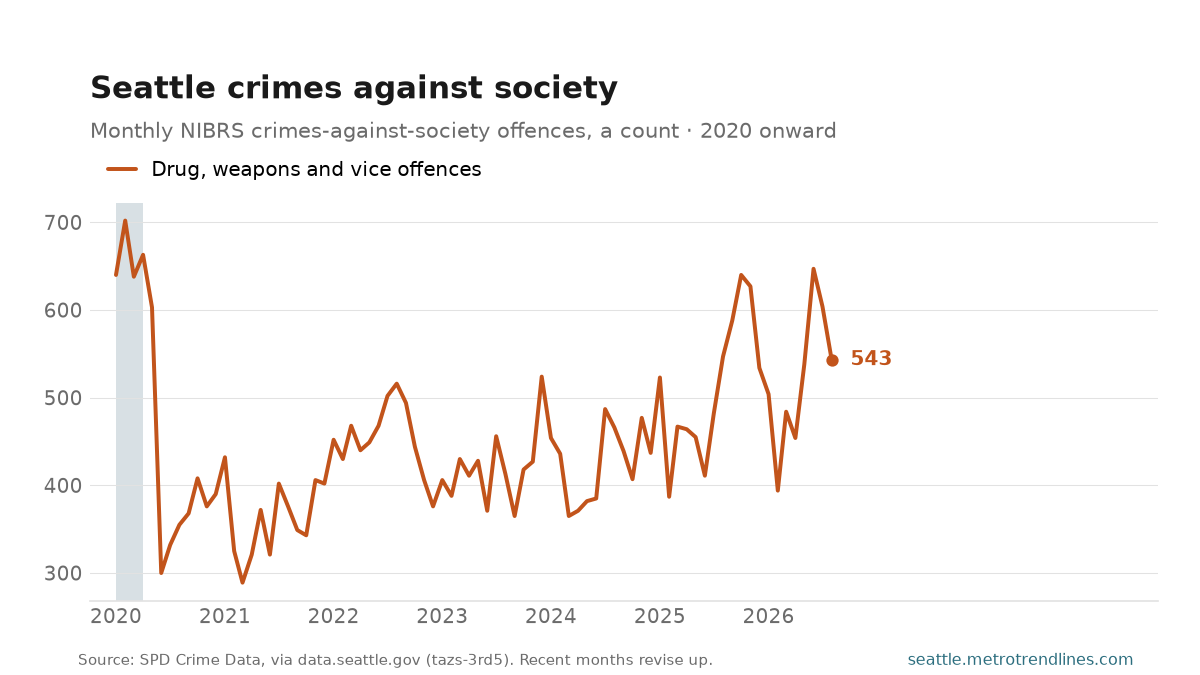
Seattle recorded 1.37 offences against persons per 1,000 residents in August 2026, and 4.93 offences against property per 1,000. In plain counts that is 1,125 offences against persons; the rate is the same fact with the city’s size divided out. Police also recorded 543 crimes against society, down 0.7% on the year.
The division is the point of the first two charts. Seattle has added well over a hundred thousand people since these records begin, so a count that rose ten per cent over a decade in which the population rose fifteen describes a city getting safer. Over the series the persons rate has run between 1.01 (February 2025) and 1.84 (August 2008) per thousand. The spike early in the property series is May 2020, a single night of widespread downtown break-ins during the George Floyd protests — one event, not a trend, and left in rather than smoothed away.
The third chart is a count, and it measures something else. Crimes against society are NIBRS’s third category: drug and narcotics offences, weapons violations, prostitution, gambling — offences with no individual complainant. Nobody calls 911 to report a drug offence against themselves, so this line measures enforcement, not incidence: it rises when a unit is staffed or a directive changes and falls when attention moves elsewhere. Dividing it by population would dress a record of what the department chose to do as a rate of something residents experience, so it stays a count.
Caveats that carry every month: this is crime reported to police, so it moves with reporting behaviour. It counts offences, not incidents. Recent months revise upward. The charts start in 2020 because SPD changed records systems in 2019. And the rate denominator is Washington OFM’s April 1 population estimate, interpolated in a straight line between years, because a step would put a false annual sawtooth into every rate here. For the counts behind the rates, see the monthly crime post.
Sources: Seattle Police Department, SPD Crime Data 2008-Present, via data.seattle.gov (Socrata tazs-3rd5), NIBRS categories; Washington State Office of Financial Management April 1 population estimates for the city of Seattle, interpolated to monthly. Auto-generated each build.
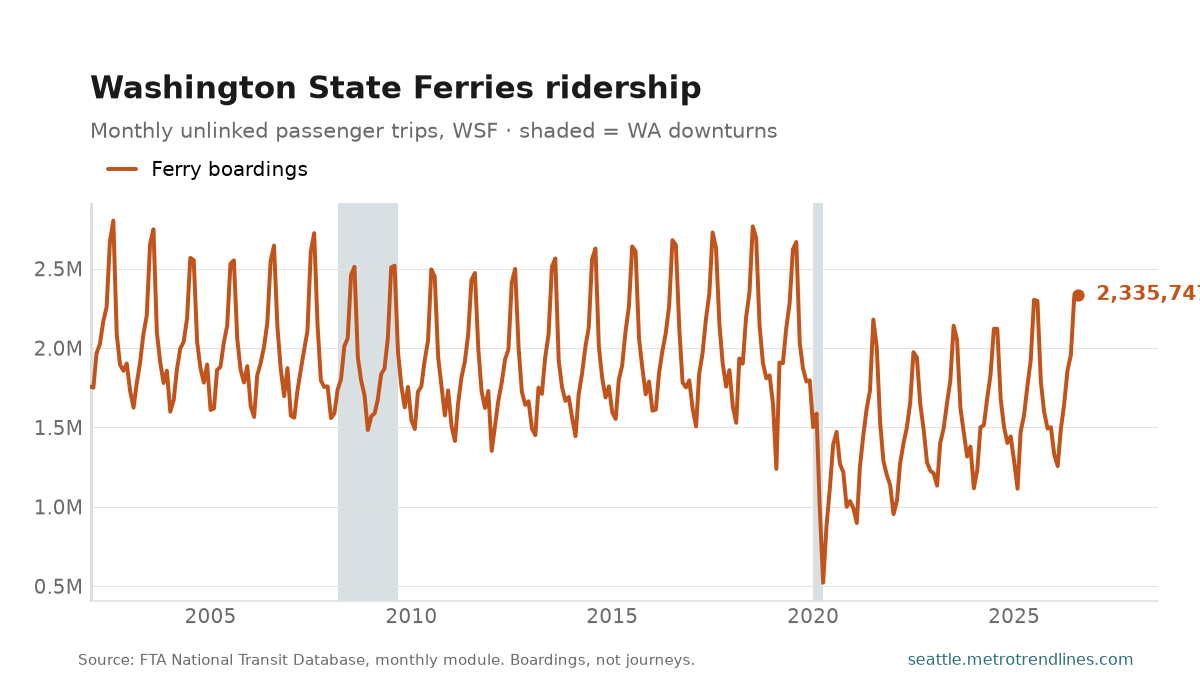
Washington State Ferries carried 2,335,747 passengers in August 2026, up 1.7% from a year earlier. The system swings hard with the season — from 522,473 in April 2020 to 2,803,031 in August 2002 — so the year-over-year figure is the one that means anything.
It is the largest ferry system in the United States and, unlike every other service charted here, it is simultaneously a commuter railway and a tourist attraction: the winter floor is people going to work on Bainbridge and Vashon, and the summer peak is everyone else. That is what makes the seasonal amplitude worth watching in its own right — a summer that runs below the usual multiple of its winter is a tourism signal, not a commuting one.
The constraint on this system is increasingly boats and crews rather than demand: sailings have been cancelled or reduced in recent years for vessel availability and staffing, and a cancelled sailing shows up here as fewer riders. Read a fall as service before reading it as demand. Boardings, not journeys; not seasonally adjusted.
Source: Federal Transit Administration, National Transit Database monthly module, Washington State Ferries unlinked passenger trips. Auto-generated each build.
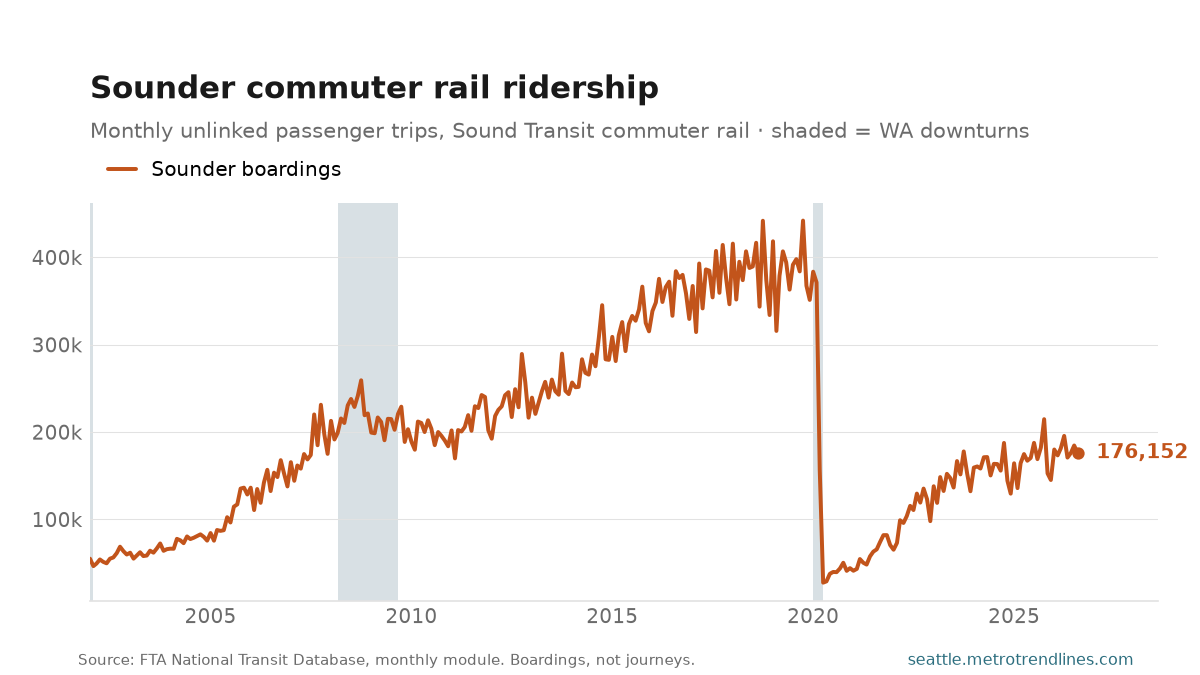
Sounder carried 176,152 boardings in August 2026, up 4.2% on the year — against a peak of 442,159 in October 2019, which makes it 60% below its high-water mark.
Sounder is the purest commuter service in the region and therefore the most exposed to remote work. It runs peak-direction trains on weekday mornings and evenings between Everett, Seattle and Lakewood, and almost nothing else — so unlike the bus or Link, it has essentially no non-commute ridership to cushion it. If you want a single number for how much the downtown office day has come back, this is the least ambiguous one on this site.
Boardings, not journeys. Service levels have changed over the period — trips added and, on the north line, cancelled for mudslides — so a fall is not always a fall in demand. Not seasonally adjusted.
Source: Federal Transit Administration, National Transit Database monthly module, Sound Transit commuter rail unlinked passenger trips. Auto-generated each build.
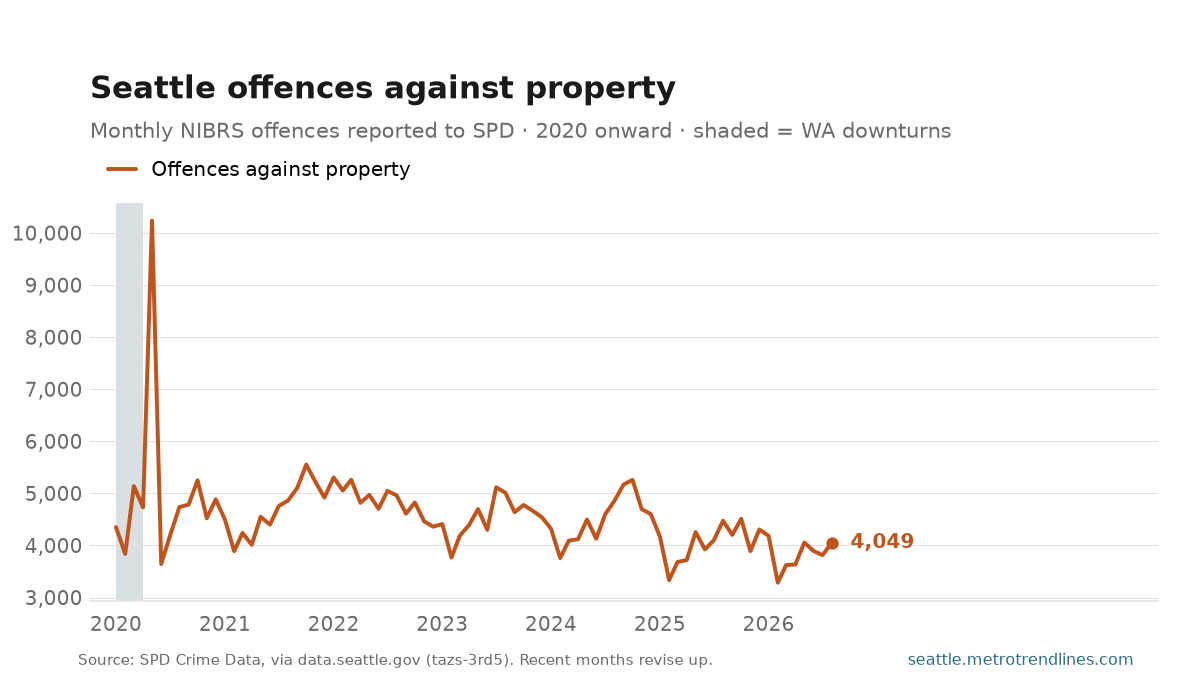
Seattle police recorded 4,049 offences against property in August 2026, down 9.5% from a year earlier. This is the bulk of reported crime in the city — burglary, car prowls, vehicle theft, shoplifting — and when a single ‘crime is up’ figure is quoted anywhere, this category is most of what moved it.
The one-month spike in May 2020 is the night of widespread downtown break-ins during the George Floyd protests. It is one event and it is left in the chart rather than smoothed away.
As always: reported crime, offences rather than incidents, and recent months revise upward. The chart starts in 2020 because of SPD’s 2019 records-system change.
Source: Seattle Police Department, SPD Crime Data 2008-Present, via data.seattle.gov (Socrata tazs-3rd5), NIBRS crimes-against-property category. Auto-generated each build.
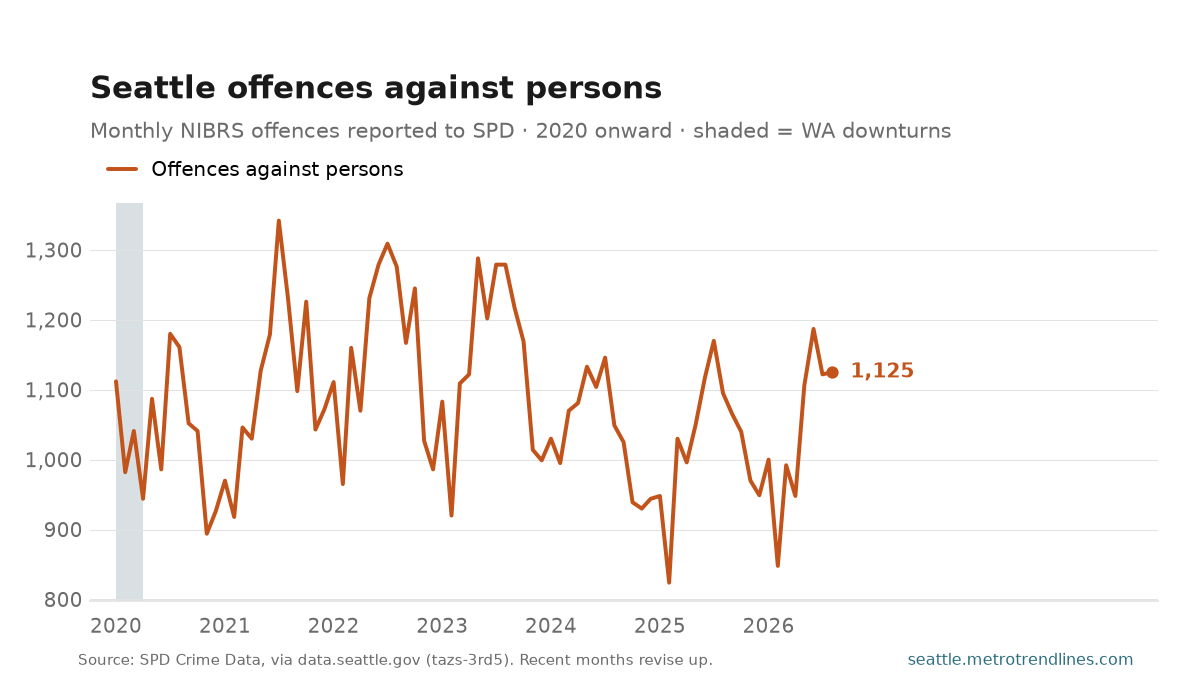
Seattle police recorded 1,125 offences against persons in August 2026, up 2.7% from a year earlier. This is the assault, robbery and homicide category — the offences with a victim who was there — and it is the one worth watching on its own rather than inside a combined crime total, where property offences outnumber it three to one and drown it out.
Three caveats carry every month. This counts crime reported to police, so it moves with reporting behaviour as well as with crime. It counts offences, not incidents. And recent months revise upward as late reports land, so the right-hand edge is provisional. For the same number with the city’s growth divided out, see the crime rate post. The chart starts in 2020 because SPD changed records systems in 2019 and the counts either side are not comparable.
Source: Seattle Police Department, SPD Crime Data 2008-Present, via data.seattle.gov (Socrata tazs-3rd5), NIBRS crimes-against-persons category. Auto-generated each build.
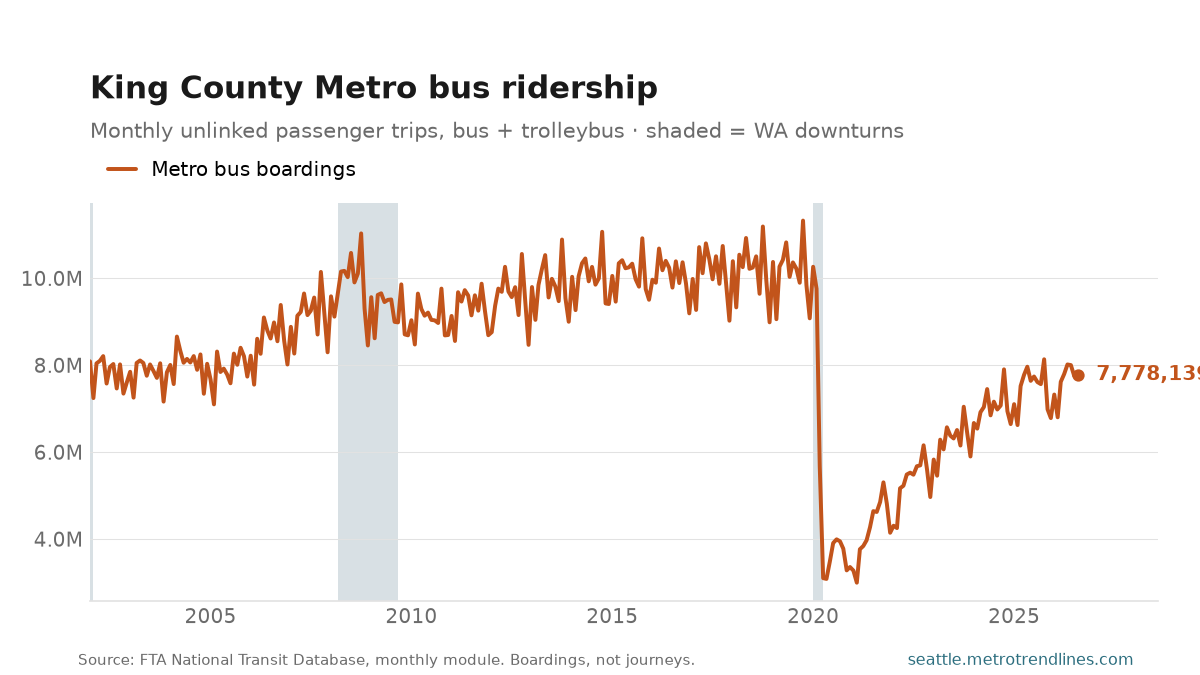
King County Metro carried 7,778,139 bus boardings in August 2026, up 2.2% on the year. The peak in this series is 11,328,648 (October 2019), which puts the latest month 31% below it.
The bus is the part of the transit system that mostly does not get written about, and it carries far more people than the train does. It is also the better economic indicator of the two: the bus network has not changed shape the way the rail network has, so its ridership moves with commuting, employment and the cost of driving rather than with construction schedules. The gap between the bus line and the rail line since 2020 is the clearest picture available of how office work changed in this region.
Trolleybus routes are included with the diesel and hybrid fleet — they are one network to a rider and splitting them would chart the vehicle procurement rather than the travel. Boardings, not journeys: a trip with a transfer counts twice. Not seasonally adjusted, so compare with the same month a year earlier.
Source: Federal Transit Administration, National Transit Database monthly module, King County Metro motorbus and trolleybus unlinked passenger trips. Auto-generated each build.