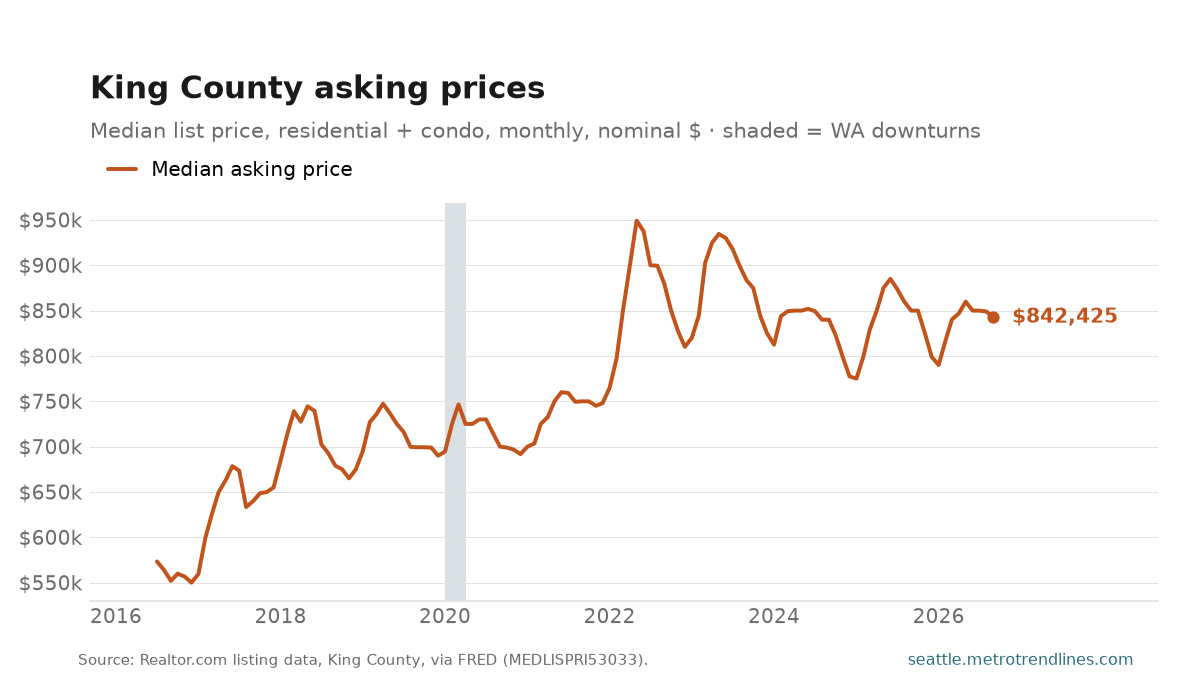
The median King County listing asked $842,425 in September 2026, down 0.9% from a year earlier. Read this as what sellers want, not what buyers pay: it is the midpoint of what is on the market, so it moves with the mix of homes listed as much as with prices. A month heavy on Eastside houses lifts it without anything getting more expensive.
For the price of what actually changes hands, home values is the better series — it holds the mix constant. This one is the faster read, and it is the one sellers are looking at.
Source: Realtor.com median listing price, King County WA, via FRED MEDLISPRI53033, nominal dollars. Auto-generated each build.
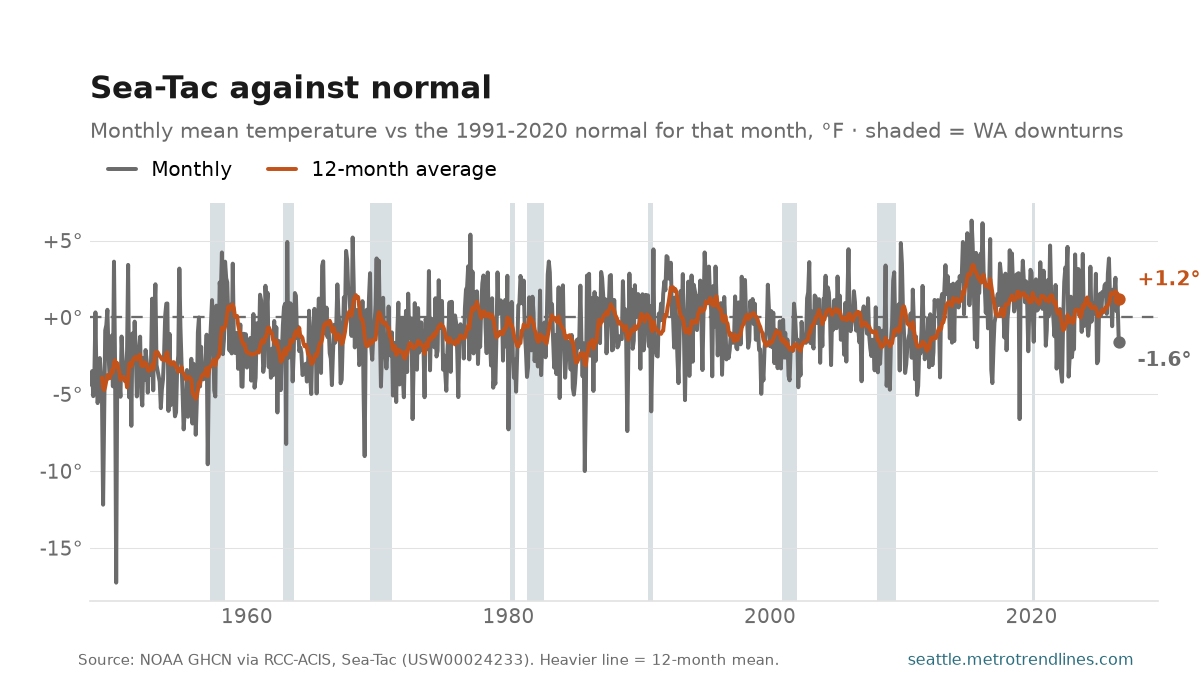
September 2026 at Sea-Tac ran 1.6°F below normal. Normal here is the 1991-2020 average for that same month, which is the standard climate baseline — so this is a comparison with the recent past, not with the start of the record.
Across the whole series, September has averaged -1.0°F against that baseline, over 79 years. The warmest was +3.7 (1967) and the coldest -6.6 (1972). A single month is weather; the reason to post one every month is that the band they fall in has moved — which is what the 12-month average on the chart is there to show.
The station is the caveat, and it is a real one. Sea-Tac is the only continuous daily record in this region back to 1948, and it is an airport twelve miles south of downtown with far more tarmac around the thermometer than it had then. Some of the drift in this line is the airport growing, not the climate — that is why the anomaly is measured against a fixed 1991-2020 baseline rather than against the 1950s, which would read the pavement as warming. It is still the best record there is.
Source: NOAA Global Historical Climatology Network daily records for Seattle-Tacoma International Airport (USW00024233), via RCC-ACIS, aggregated to monthly means and differenced against the 1991-2020 normal for each calendar month. Auto-generated each build.
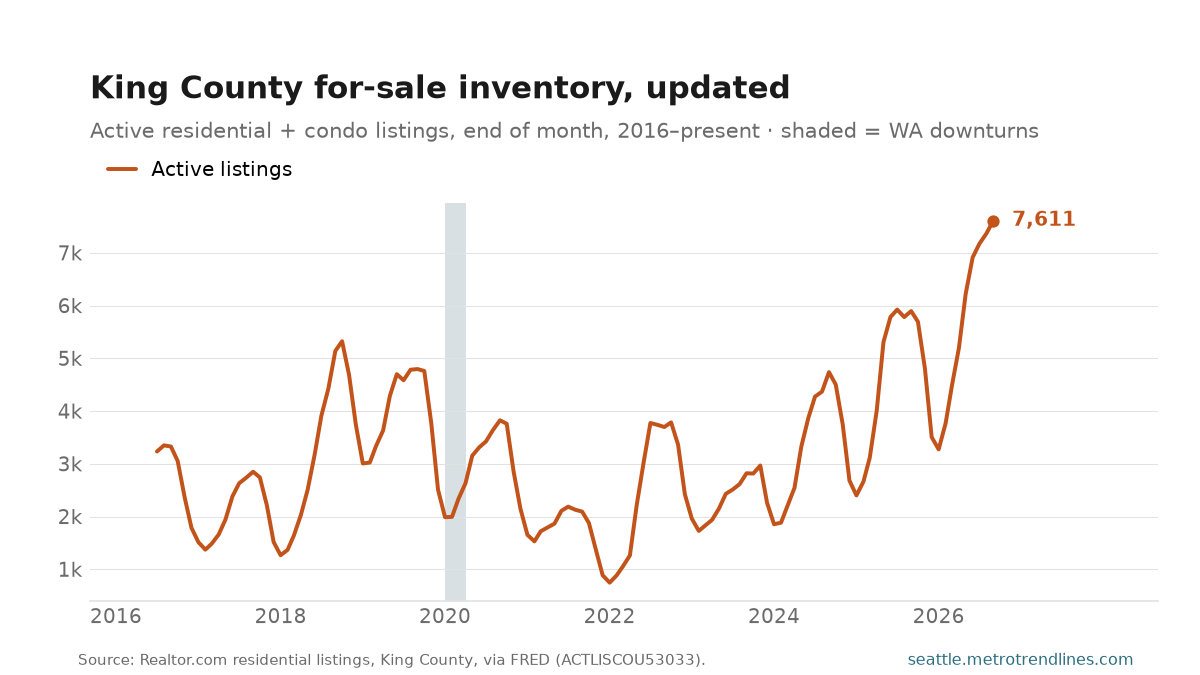
King County ended September 2026 with 7,611 active for-sale listings, up 29.1% from a year earlier — the monthly update to King County’s inventory rebuild.
Source: Realtor.com residential listing inventory, King County WA, via FRED ACTLISCOU53033. Auto-generated each build.
What’s coming on seattletrendlines.com the week of October 5–9 — 10 posts, two a day, every weekday.
Monday, October 5 — King County for-sale inventory, September 2026; Sea-Tac against normal, September 2026.
Tuesday, October 6 — King County asking prices, September 2026; What King County sellers listed, September 2026.
Wednesday, October 7 — How long a King County listing sits, September 2026; King County homes under contract, September 2026.
Thursday, October 8 — Seattle’s labor force, August 2026; Seattle-metro unemployment, August 2026.
Friday, October 9 — Washington jobless claims, week of Sep 26, 2026 (pending — its numbers haven’t landed yet); Link light rail ridership, August 2026.
This is the plan, not a promise. Every weekday post here is tied to a data release, and a release that slips takes its post with it — the post simply waits for the day its numbers land. A figure that arrives early, a revision worth writing about, or an unexpected story out of Seattle can just as easily add a post that isn’t on this list. Expect the week to look roughly like this, and expect at least one day of it not to.
The week of September 28 – October 2 on seattletrendlines.com, in 11 posts.
Monday, September 28 — Seattle Fire 911 responses, August 2026. Seattle Fire dispatched 10,147 responses in August 2026, up 2.9% from a year earlier.
Monday, September 28 — Seattle Fire overdose responses, August 2026. Seattle Fire was dispatched to 98 overdose calls in August 2026, down 30.5% from a year earlier. Across the series the monthly count has run between 68 (August 2022) and 233 (October 2023).
Monday, September 28 — Building permits, month by month, August 2026. The Seattle metro permitted 990 housing units in August 2026. Against the trailing twelve months — 20,152 units — that single month is worth roughly 5% of a year.
Tuesday, September 29 — The three parks, August 2026. The three national parks within a few hours of Seattle drew 881,708 recreation visits in August 2026: 397,493 at Mount Rainier, 528,764 at Olympic and 4,991 at North Cascades. Three charts, not three lines.
Tuesday, September 29 — Seattle tech employment, August 2026. The Seattle metro’s information sector employed 132,100 people in August 2026, down 0.4% from a year earlier. The sector peaked at 151,200 in June 2022; it started this chart at 34,500 in January 1990.
Wednesday, September 30 — Checkouts per Seattleite, August 2026. Seattle Public Library lent 888,922 items in August 2026 — 1.08 per city resident, up 7.4% on the year as a rate.
Wednesday, September 30 — Seattle home prices, June 2026. The monthly home-price refresh, from the two measures that disagree usefully. Case-Shiller put the Seattle index at 393.2 in June 2026, down 1.9% on the year.
Thursday, October 1 — Checkouts per Seattleite, August 2026. Seattle Public Library lent 888,922 items in August 2026 — 1.08 per city resident, up 7.4% on the year as a rate.
Thursday, October 1 — Seattle-metro other services jobs, August 2026. Seattle-metro other services employers had 75,400 people on payroll in August 2026, up 0.8% from a year earlier. That is 3.5% of all payroll jobs in the metro, against 3.5% a year before.
Friday, October 2 — Seattle home prices, July 2026. The monthly home-price refresh, from the two measures that disagree usefully. Case-Shiller put the Seattle index at 391.3 in July 2026, down 1.6% on the year.
Friday, October 2 — What Seattle reports to the city, September 2026. Seattle residents filed 31,453 service requests in September 2026 — potholes, graffiti, illegal dumping, abandoned vehicles, encampments — up 0.8% from a year earlier.
The week in review: every post from September 28 – October 2, summarised from its own listing blurb and linked. Assembled each Saturday from the posts that actually published that week.
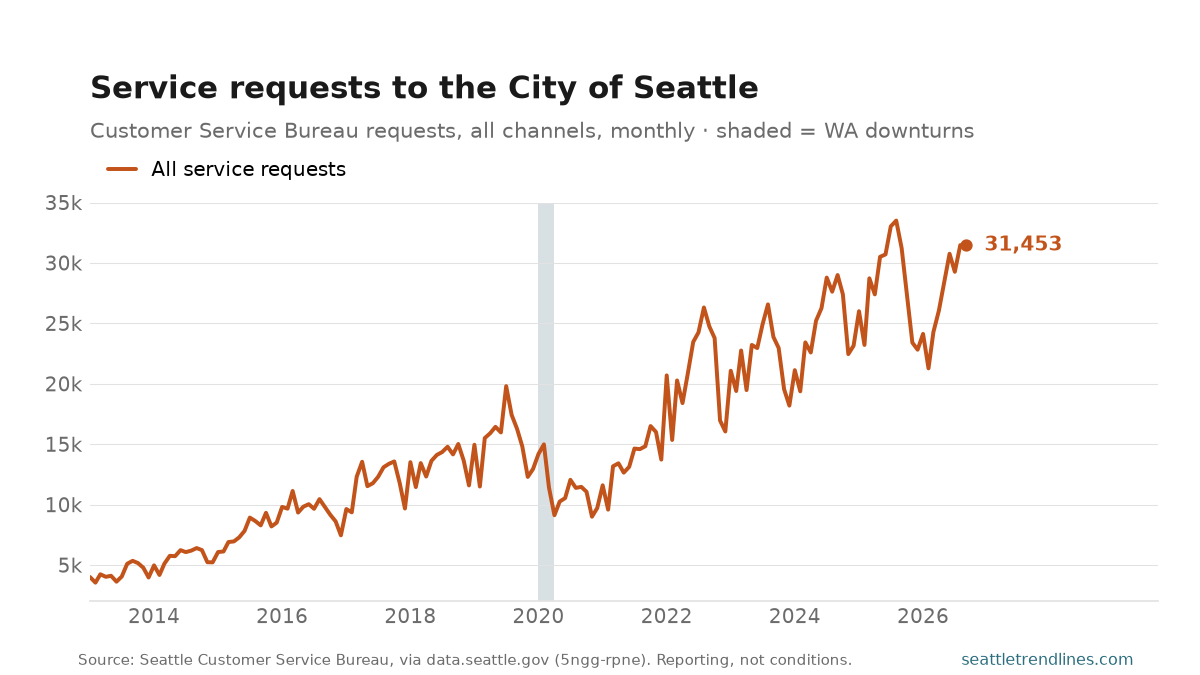
Seattle residents filed 31,453 service requests in September 2026 — potholes, graffiti, illegal dumping, abandoned vehicles, encampments — up 0.8% from a year earlier. The series opens at 4,014 a month in January 2013; its high was 33,503 in August 2025.
This measures reporting, not conditions, and the two come apart. A month with more graffiti reports is a month more people told the city about graffiti, which moves with how easy reporting is at least as much as with how much graffiti there is. Over the span of this chart intake moved from phone calls to the Find It, Fix It apps, and a channel that takes thirty seconds collects complaints a channel that takes ten minutes never heard. Read a rise here as demand for city services being expressed, not as the city getting worse.
The independent check is a feed nobody chooses to file into — the fire department’s 911 dispatches, which are also on this site. Where the two move together, something real is happening; where only this one moves, the channel changed. Requests are dated by when they were created, and one incident reported by three neighbours is three rows.
Source: Seattle Customer Service Bureau, Customer Service Requests, via data.seattle.gov (Socrata 5ngg-rpne), all intake channels. Bench post — generated from the latest observation in the site database.
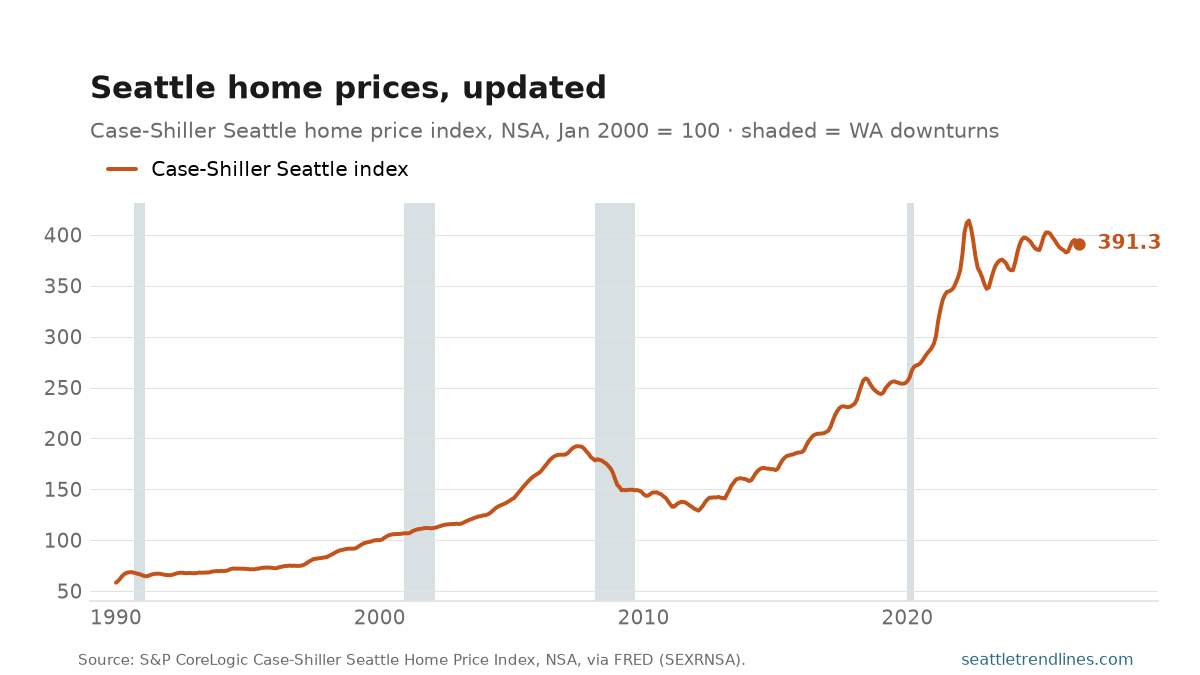
The monthly home-price refresh, from the two measures that disagree usefully. Case-Shiller put the Seattle index at 391.3 in July 2026, down 1.6% on the year. Zillow’s index valued the typical metro home at $727,359 in August 2026, down 1.5% on the year. They measure different things — Case-Shiller tracks repeat sales of the same homes and reports a three-month average two months late; Zillow values the entire housing stock monthly — so treat Case-Shiller as the shape and Zillow as the level.
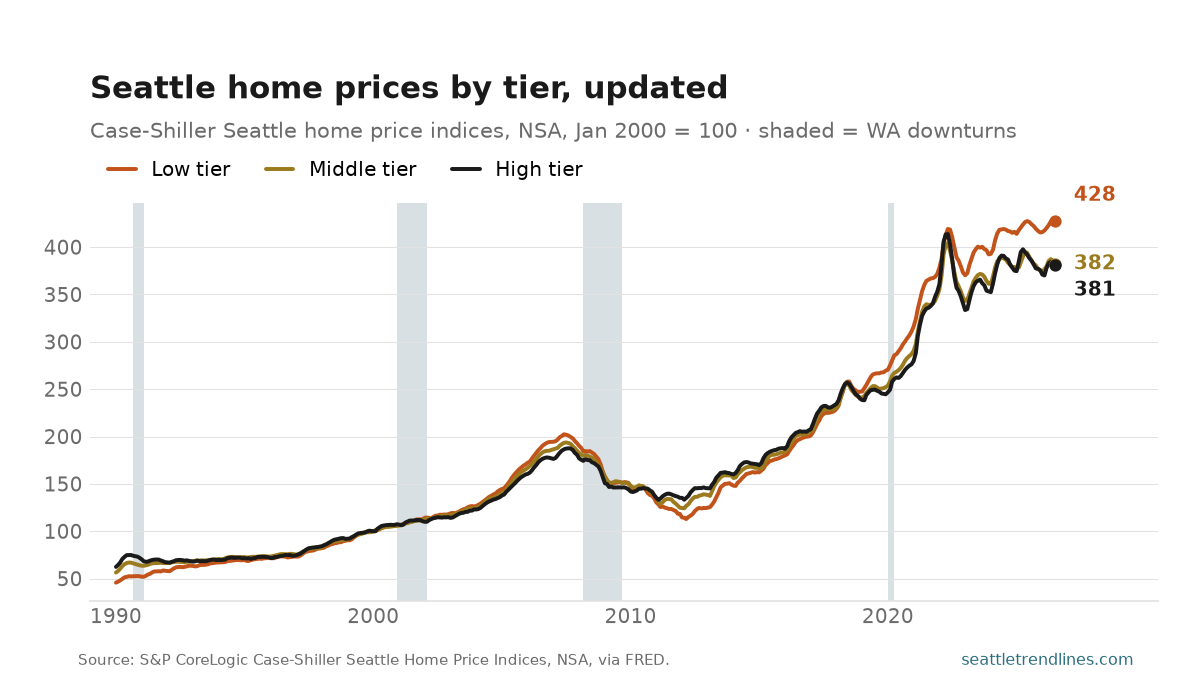
The second chart shows the tier split, and it is the reason this post carries Case-Shiller at all: S&P divides the metro’s repeat sales into thirds by price, and the cheapest third has outrun the most expensive third for over a decade. That is what a supply shortage at the bottom of a market looks like, and no single headline index can show it.
Source: S&P CoreLogic Case-Shiller Seattle Home Price Indices, not seasonally adjusted, via FRED (SEXRNSA and the tier series). Auto-generated each build.
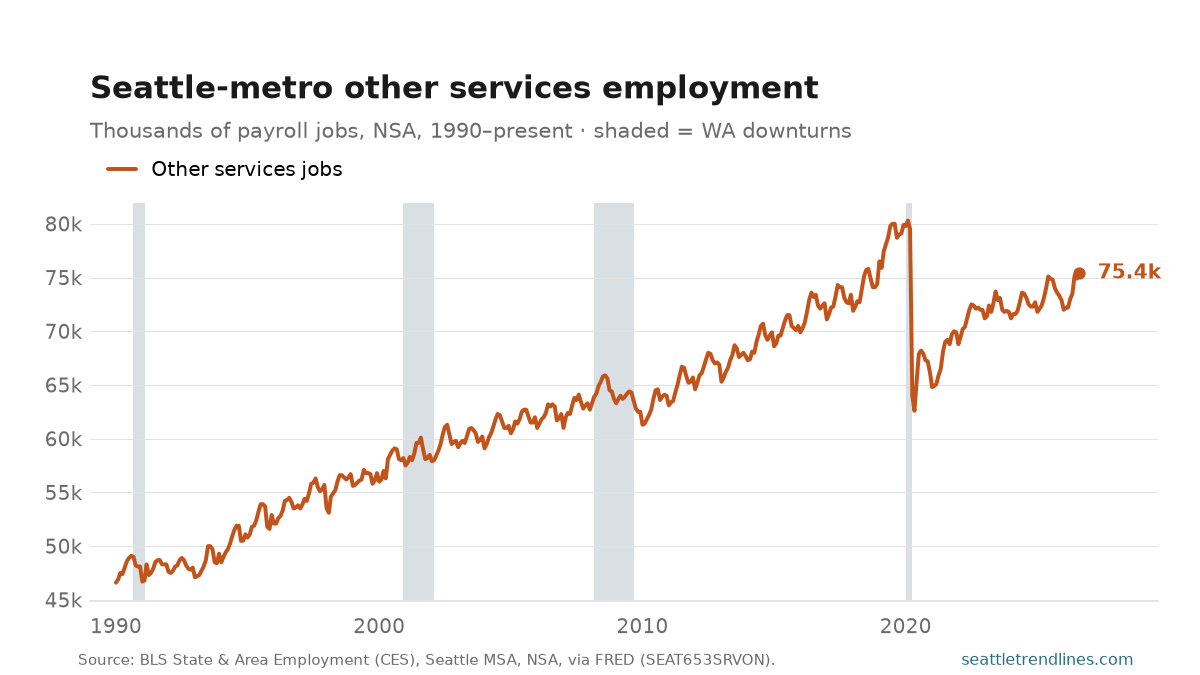
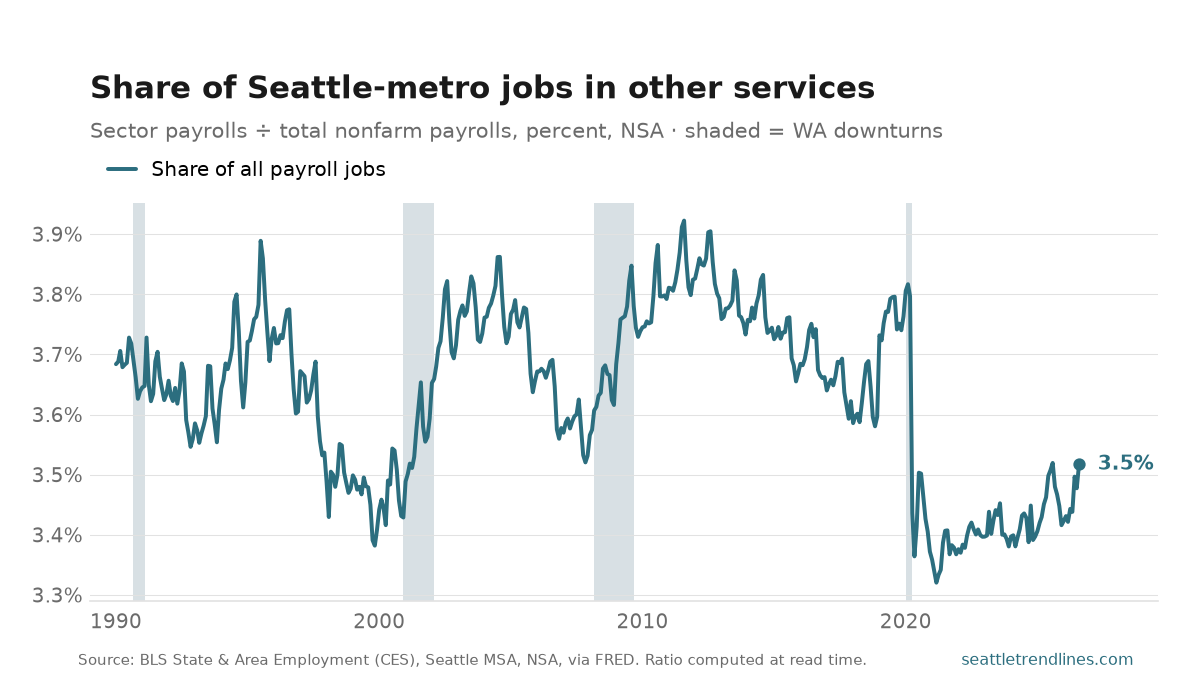
Seattle-metro other services employers had 75,400 people on payroll in August 2026, up 0.8% from a year earlier. That is 3.5% of all payroll jobs in the metro, against 3.5% a year before.
The small, neighbourhood-scale part of the economy: repair and maintenance shops, hair and nail salons, dry cleaners, funeral homes, religious congregations, unions and civic and professional associations. It is the sector most made of face-to-face work in small businesses, which is why the spring of 2020 hit it so hard — and why its count is worth watching for whether it ever gets back to where it was before.
The two charts answer different questions. The count peaked at 80,300 in February 2020 and says whether the sector is hiring. The share — from 3.7% in January 1990, with a high of 3.9% in August 2011 and a low of 3.3% in March 2021 — says whether it is growing faster or slower than the rest of the economy.
Not seasonally adjusted, so compare a month with the same month a year earlier. The share is computed at read time from two series in the same BLS release, so it stays consistent when the levels are revised.
Source: U.S. Bureau of Labor Statistics, State & Area Employment, other services and total nonfarm payrolls, Seattle–Tacoma–Bellevue MSA, not seasonally adjusted, via FRED (SEAT653SRVON, SEAT653NAN). The share is derived at read time. Auto-generated each build.
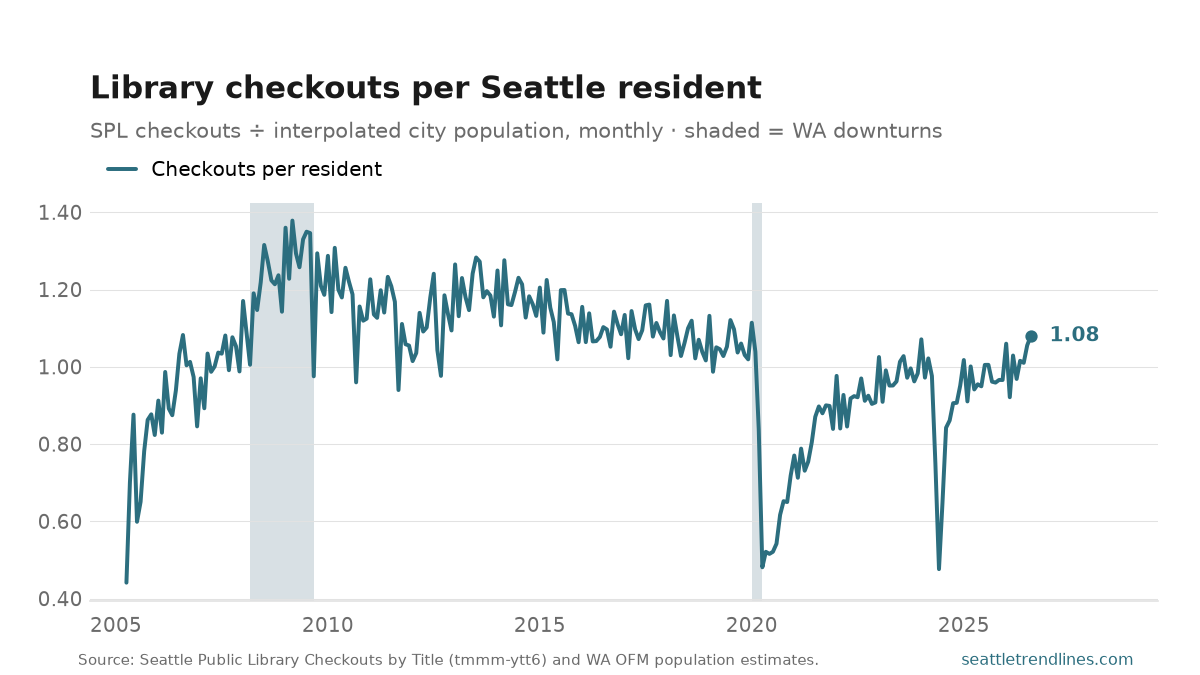
Seattle Public Library lent 888,922 items in August 2026 — 1.08 per city resident, up 7.4% on the year as a rate.
Per head is the version of this series that can be compared across twenty years, because Seattle in August 2026 is a substantially larger city than the one the series starts in. The peak was 1.38 checkouts per resident in March 2009; the floor was 0.44 in April 2005. The checkout count tracks the library’s total workload, which is the right measure for the library; this one tracks how much the average Seattleite uses it, which is the right measure for the city.
Two dents in the line are events rather than trends: the 2020 branch closures, and a ransomware attack over Memorial Day weekend 2024 that took down the catalogue, the public computers and the e-book platforms, with service restored only in stages over the months that followed. Checkouts that could not be made — or could not be recorded — are simply missing from the count. It counts checkout events rather than borrowers, so one person taking out six books is six. The denominator is OFM’s April 1 city estimate, interpolated between years.
Sources: Seattle Public Library, Checkouts by Title, via data.seattle.gov (Socrata tmmm-ytt6); Washington State Office of Financial Management April 1 population estimates for the city of Seattle, interpolated to monthly. Auto-generated each build.
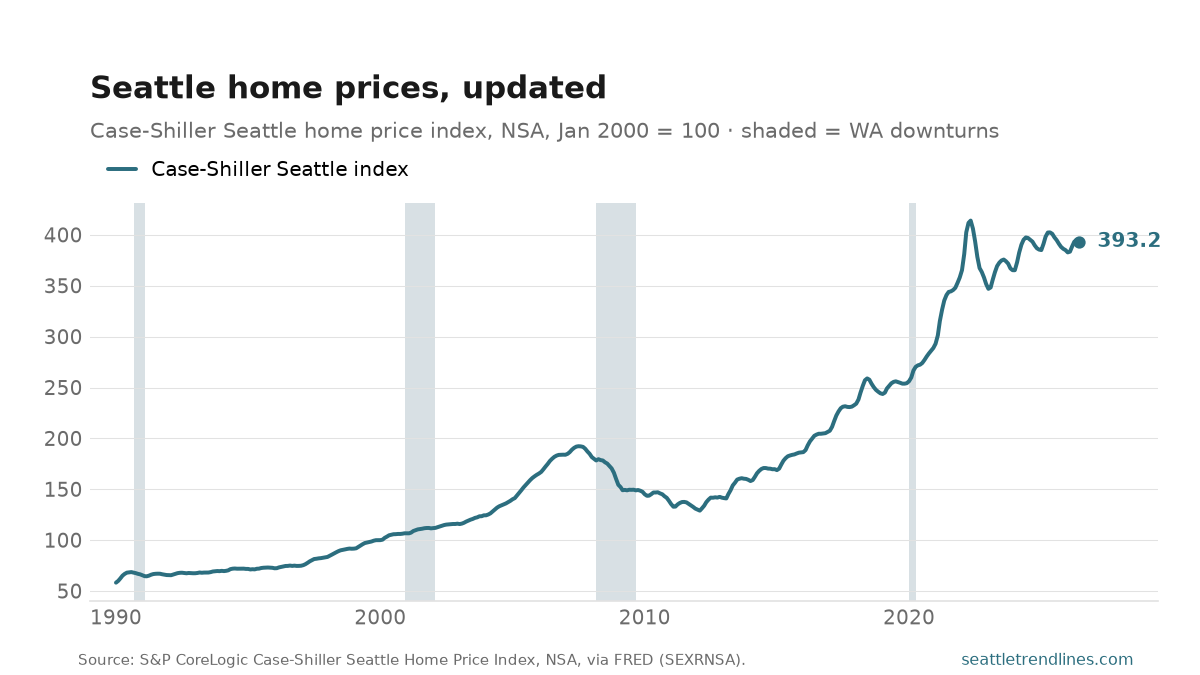
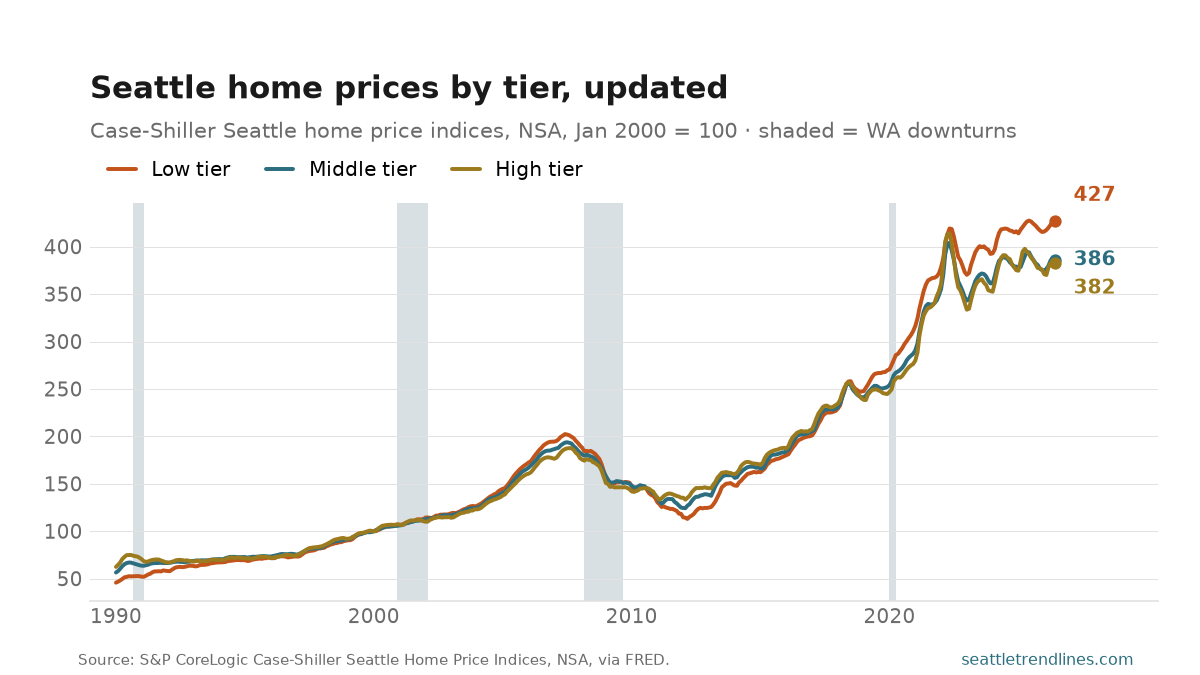
The monthly home-price refresh, from the two measures that disagree usefully. Case-Shiller put the Seattle index at 393.2 in June 2026, down 1.9% on the year. Zillow’s index valued the typical metro home at $727,359 in August 2026, down 1.5% on the year. They measure different things — Case-Shiller tracks repeat sales of the same homes and reports a three-month average two months late; Zillow values the entire housing stock monthly — so treat Case-Shiller as the shape and Zillow as the level.
The second chart shows the tier split, and it is the reason this post carries Case-Shiller at all: S&P divides the metro’s repeat sales into thirds by price, and the cheapest third has outrun the most expensive third for over a decade. That is what a supply shortage at the bottom of a market looks like, and no single headline index can show it.
Source: S&P CoreLogic Case-Shiller Seattle Home Price Indices, not seasonally adjusted, via FRED (SEXRNSA and the tier series). Auto-generated each build.