The Seattle metro unemployment rate, three decades on one line
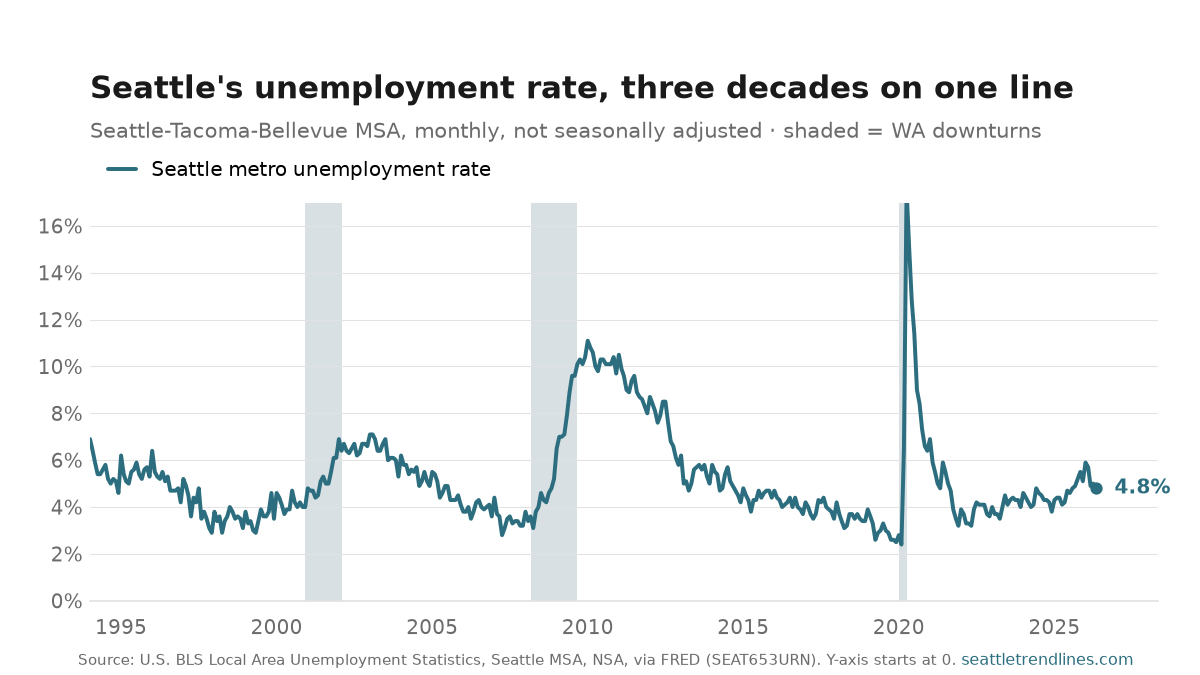
The unemployment rate is the number everyone reaches for first, and for good reason: it compresses the whole regional labor market into a single, comparable figure — the share of people who want work and are actively looking but haven’t found it. This is the Seattle-Tacoma-Bellevue metro version, monthly, back to 1994. As of May 2026, the most recent month BLS has published, it stands at 4.8% — up from 4.2% in May 2025.
Read the line as a history of the region’s shocks. It climbs to about 7% in the dot-com bust of the early 2000s, and to nearly 11% after the 2008–09 financial crisis — a slower, longer climb that took until 2016 to fully unwind. Then it does something no prior recession did: spikes almost vertically in the spring of 2020, from 2.4% in February to 17.6% in April, as the pandemic shut the economy overnight. What followed was the fastest recovery in the series. By 2022 the rate was back near 3%, and it has spent the years since in a band between roughly 3% and 5% — low by the standards of this chart, but drifting upward through the past year.
Two reading notes. This is not seasonally adjusted, so the sawtooth — a bump most winters, a dip each fall — is calendar, not economic news; watch the level against the same month a year earlier, which is why the January 2026 reading of 5.9% is less alarming than it looks. And an unemployment rate is a ratio, so it can fall for the wrong reason: people who stop looking for work leave the denominator, and the rate improves with nobody hired. Pair this with the jobs-by-sector counts to see whether a low rate reflects real hiring or a shrinking labor force.
Source: U.S. Bureau of Labor Statistics, Local Area Unemployment Statistics, Seattle-Tacoma-Bellevue WA MSA, via FRED series SEAT653URN. Not seasonally adjusted; percent of the labor force, dated to the first of each month. New months post about three weeks after month-end. This chart is frozen at May 2026, the latest month available when the post published; later months appear in the monthly unemployment updates. State downturns shaded from FRED WAPHCI.