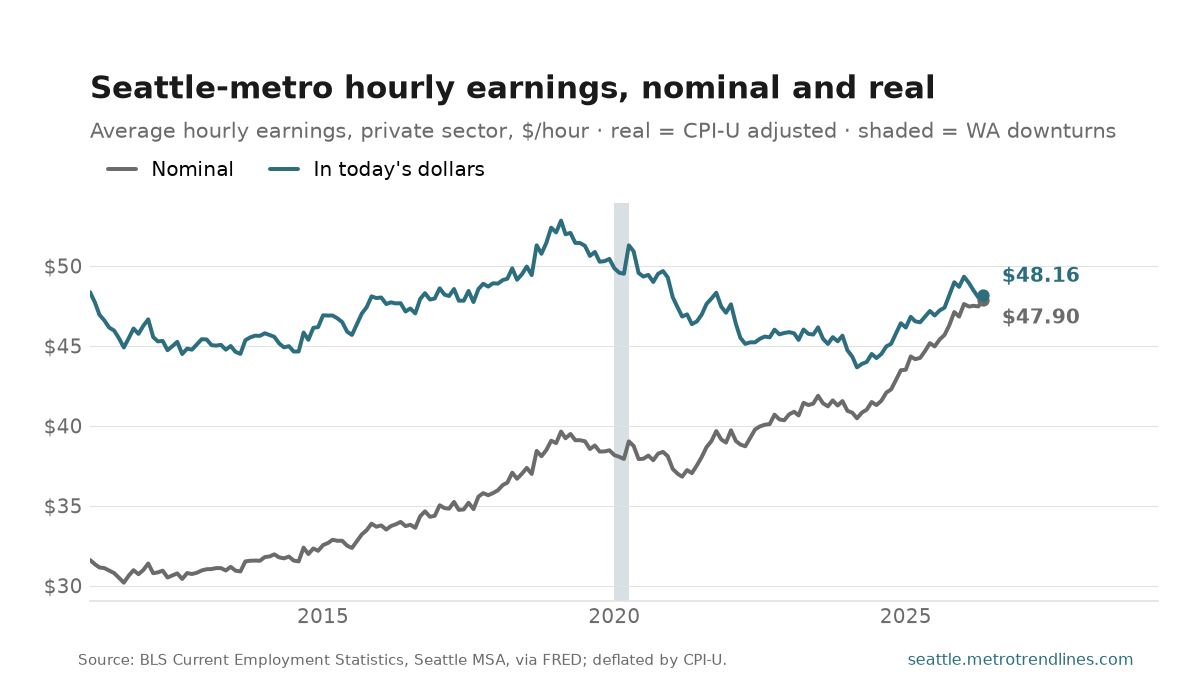
Private-sector workers in the Seattle metro averaged $47.90 an hour in May 2026. Adjusted for inflation that is $48.16 in today’s money, up 2.9% from a year earlier.
The two lines are the post. Nominal pay in this region has gone up almost every month for fifteen years, which is the number that gets announced; whether it bought more is a different question, and between 2021 and 2023 the answer was no. The real series peaked at $52.84 in February 2019.
An average, not a median, so it is pulled upward by high earners — this is a metro where that matters more than most. It also moves with who is working: a month that sheds low-wage jobs raises the average without raising anyone’s pay, which is much of what happened in 2020.
Source: U.S. Bureau of Labor Statistics, Current Employment Statistics, average hourly earnings of all private employees, Seattle–Tacoma–Bellevue MSA, via FRED; real series deflated by CPI-U to the latest available period. Auto-generated each build.
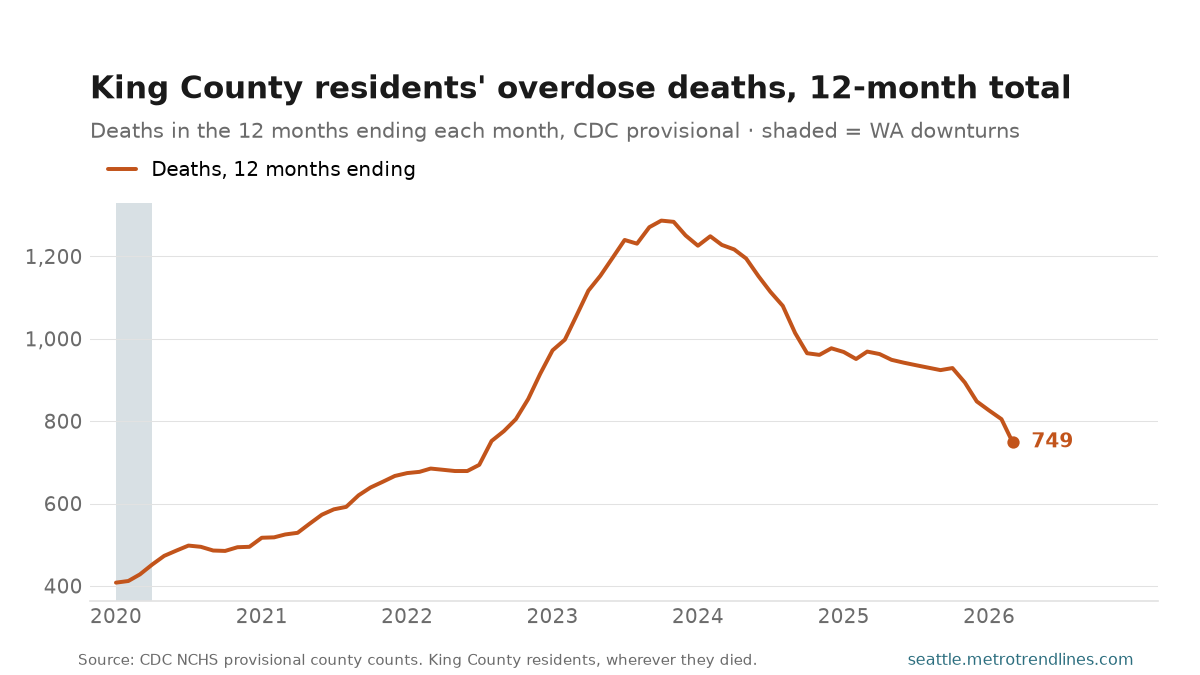
749 King County residents died of a drug overdose in the 12 months to March 2026, by the CDC’s provisional count — down 22.7% from the 12 months to March 2025. The rolling total peaked at 1,287 in the 12 months to October 2023, and the latest is 41.8% below it.
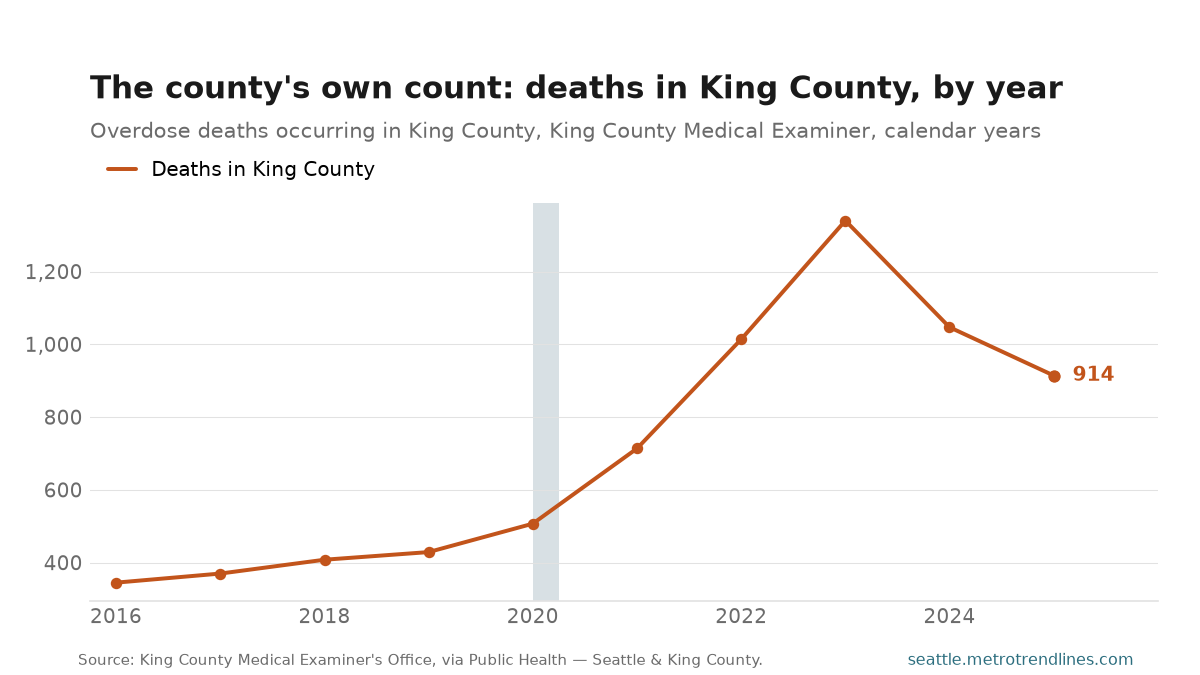
There are two counts of overdose deaths in King County, and they do not agree. The county’s own figure comes from the King County Medical Examiner: 914 deaths in 2025, the number in the annual post. CDC’s count for the same year is 848. They count different deaths. The Medical Examiner counts every overdose death that happens in King County, wherever the person lived. CDC counts King County residents, wherever they died. Someone from Snohomish or Pierce County who dies in Seattle is in the county’s count and not in CDC’s. CDC’s count is also provisional: deaths still waiting on toxicology are missing, so its newest months read low and rise for a year or more.
Each point on the chart is a total for 12 months, not one month’s deaths, so the line moves slowly by design and a turn appears months after it happened. CDC publishes six months after the death and updates the county figures every quarter, which is why this post runs four times a year.
Source: CDC National Center for Health Statistics, VSRR Provisional County-Level Drug Overdose Death Counts, King County residents, 12 months ending; King County Medical Examiner’s Office via Public Health — Seattle & King County, deaths occurring in King County. Provisional counts are incomplete and rise as pending records close. Auto-generated each build.
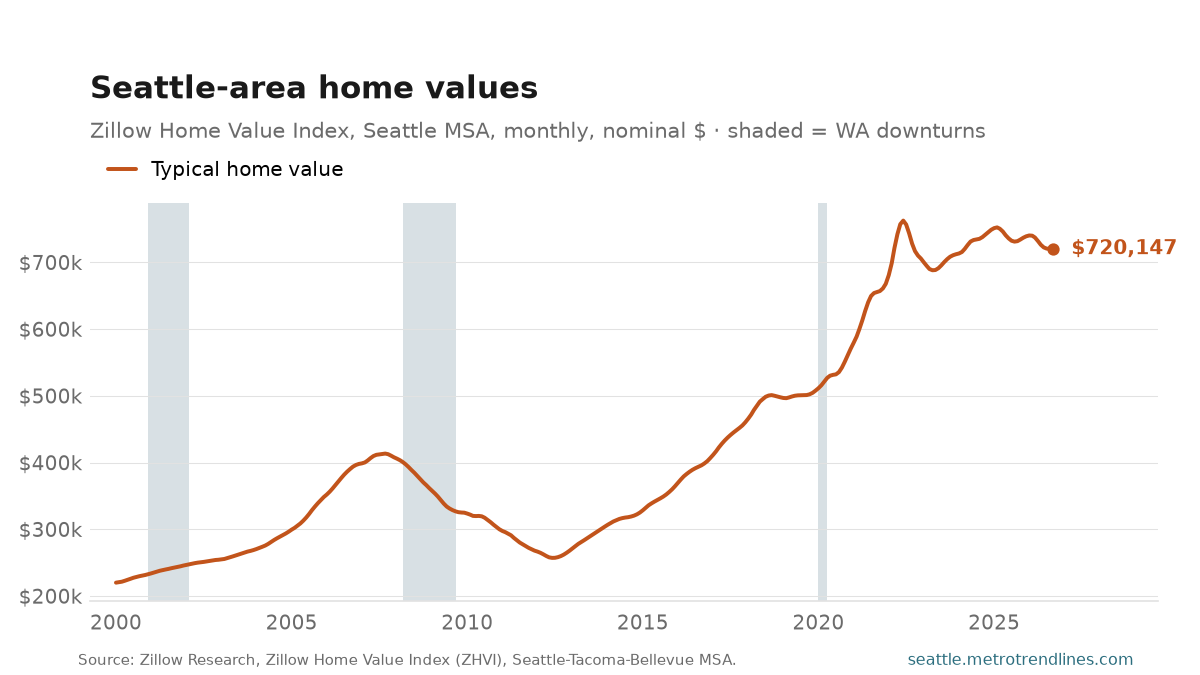
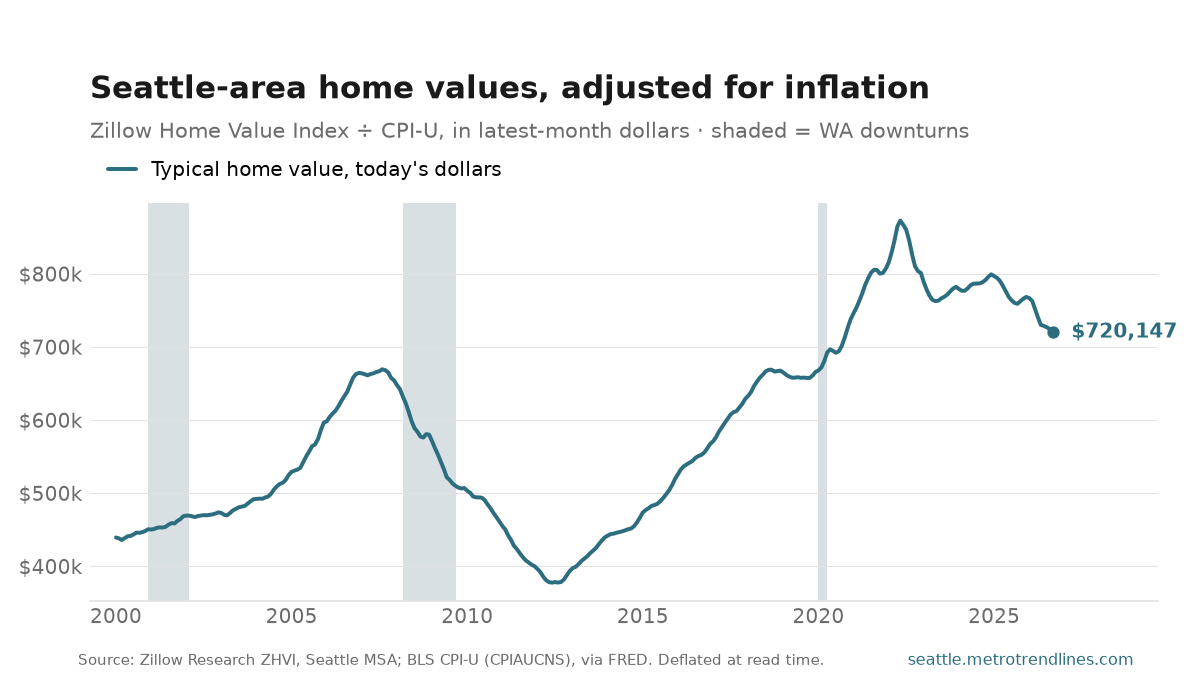
The typical Seattle-metro home was worth $720,147 in September 2026, down 1.6% from a year earlier. Against the series high of $762,709 in June 2022, that leaves the market 5.6% below its high-water mark in the dollars on the price tag.
The second chart takes inflation out. The price index runs through September 2026, and in that month’s dollars the typical home was worth $720,147, down 5.2% in real terms on the year. The real peak was $873,028 in May 2022, and today sits 18% below it. A flat price in a year of inflation is a fall in what a house is worth measured in everything else a household buys.
ZHVI measures the value of the typical home rather than the price of the homes that happened to sell, so it does not lurch when an expensive neighbourhood has a busy month — which is what makes it readable month to month, and a better trend line than asking prices.
The real series is deflated by the national CPI-U (all items, not seasonally adjusted) and stated in dollars of the latest month the CPI covers, so it can end a month before the nominal line. National rather than Seattle CPI because the Seattle index is published only every other month. Shelter is about a third of CPI-U, so read the real line as a house measured in purchasing power, not as house prices net of housing inflation. Metro-wide; Zillow revises the back series when its model is updated, so older points can move slightly between builds.
Sources: Zillow Research, Zillow Home Value Index (ZHVI), all homes, Seattle–Tacoma–Bellevue MSA; U.S. Bureau of Labor Statistics CPI-U, U.S. city average, all items, NSA, via FRED CPIAUCNS. Real values are computed at read time. Auto-generated each build.
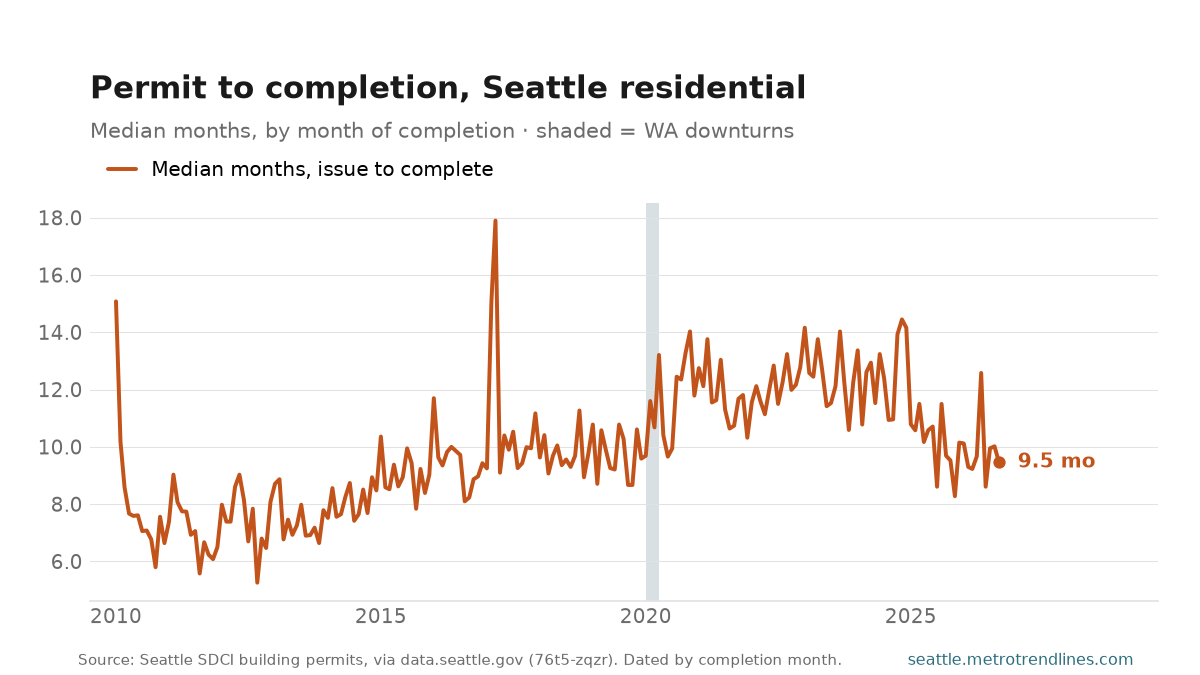
Residential building work finished in September 2026 had taken a median of 9.5 months from the day its permit was issued, across 391 completed permits. A year earlier the median was 9.7 months. Over the series it has run between 5.3 months (September 2012) and 17.9 (March 2017).
This is the half of the housing debate that permit counts miss. How many units a city permits is the number everyone argues about; how long those units then take to exist is what decides when anyone lives in them. A city can permit its way to a record year and add nothing to the housing stock for two more.
Read the dating carefully, because it is the one thing that can mislead here. Each month counts permits that finished in it, not permits issued in it. That is the only computable choice — the permits taking longest have not finished yet, so dating by issue month would report only the fast ones and understate the lag by construction — but it means a month is characterised by whatever happened to complete in it. Completion is a records event as well as a building one, so a batch of old permits closed in an administrative clean-up lands as one slow month. Median rather than mean, so a single decade-long project does not move the line, and months with fewer than 20 completions are dropped.
Source: City of Seattle SDCI, Built Environment Permits, via data.seattle.gov (Socrata 76t5-zqzr). Median months from issue to completion for residential permits, dated by month of completion; months with fewer than 20 completions are dropped. Auto-generated each build.
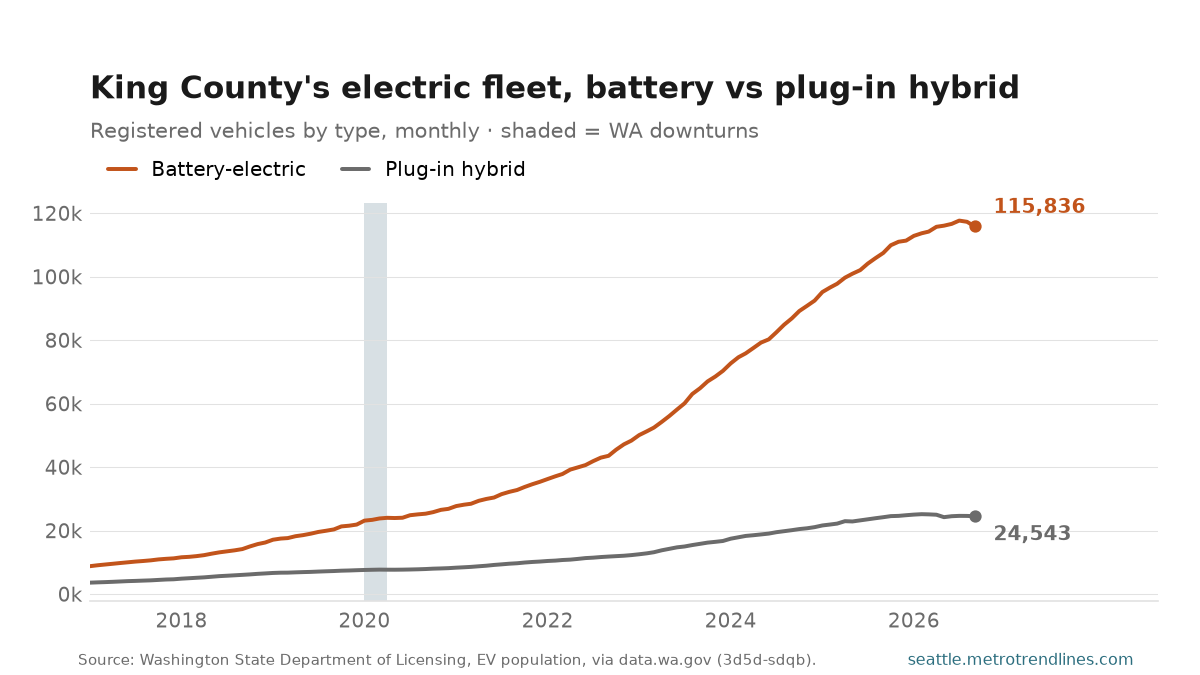
King County had 115,836 battery-electric vehicles and 24,543 plug-in hybrids registered in September 2026 — batteries are 83% of the county’s electric fleet. The battery count is up 7.7% from a year earlier.
The split is the interesting part. Plug-in hybrids were the hedge — battery for the commute, petrol for the mountain pass — and the two lines started the series close together. They are not close now, which is a statement about how far charging infrastructure and range have come rather than about policy.
Registrations are a stock, not sales: this is what was on the road that month.
Source: Washington State Department of Licensing, Electric Vehicle Population, King County, via data.wa.gov (Socrata 3d5d-sdqb). Auto-generated each build.
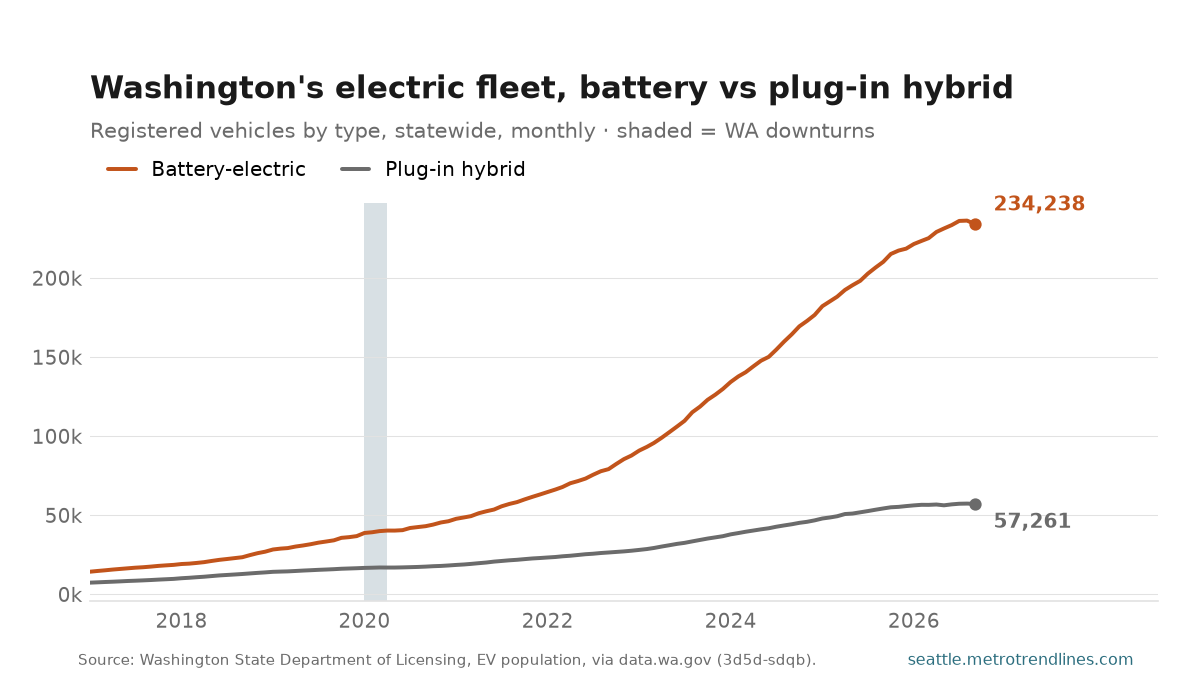
Washington registered 234,238 battery-electric vehicles and 57,261 plug-in hybrids in September 2026. Batteries are 80% of the state’s electric fleet, and their count is up 11.4% on the year.
Statewide the gap is wider than King County’s, which is the opposite of what the geography would suggest: the plug-in hybrid is the car for long drives and thin charging networks, so a rural state might have been expected to keep more of them. It has not. Whatever is driving the shift to full battery is not a Seattle phenomenon.
A stock rather than sales — the vehicles registered in that month.
Source: Washington State Department of Licensing, Electric Vehicle Population, statewide, via data.wa.gov (Socrata 3d5d-sdqb). Auto-generated each build.
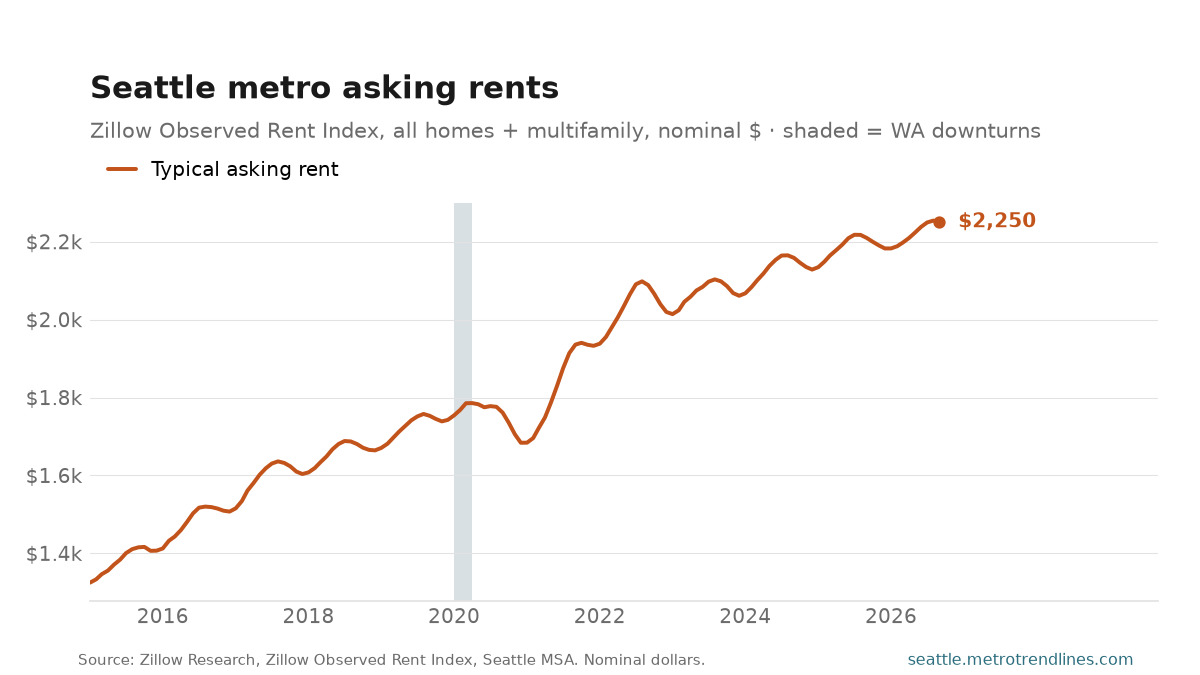
The typical asking rent in the Seattle metro was $2,250 a month in September 2026, up 1.8% from a year earlier.
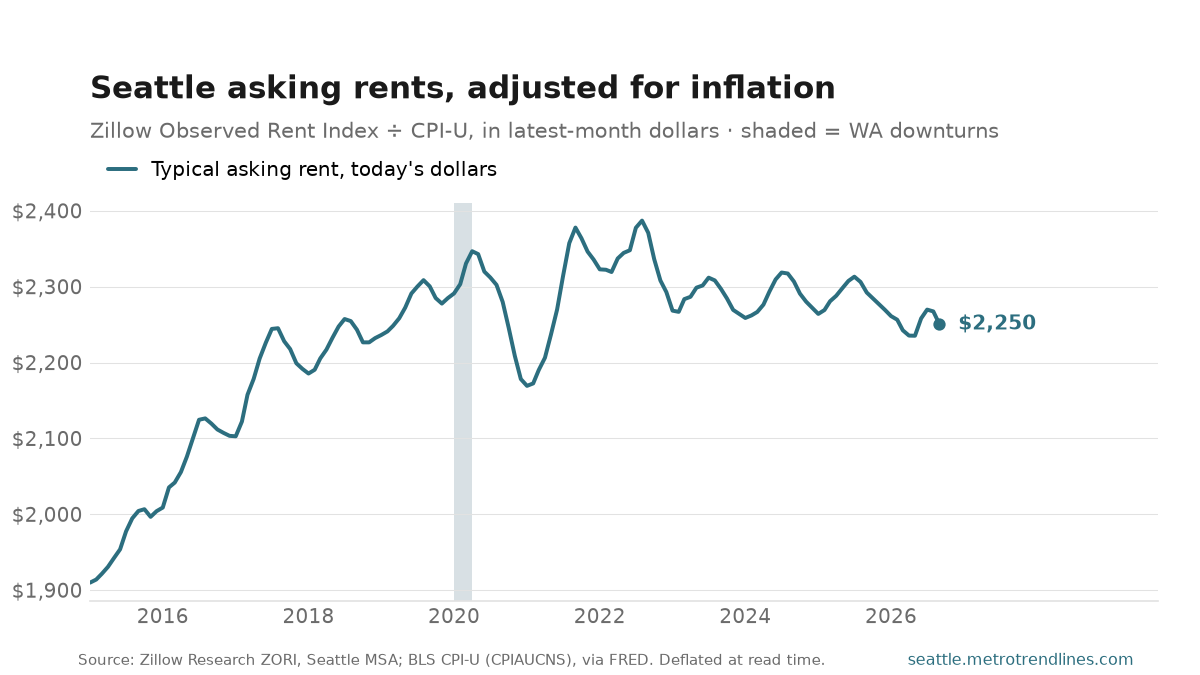
The second chart takes inflation out. The price index runs through September 2026, and in that month’s dollars the typical asking rent was $2,250, down 1.8% in real terms on the year and 6% below its real peak of $2,387 in August 2022. When the nominal line climbs and the real one does not, rents are rising more slowly than prices in general — which is not the same thing as rent getting affordable, since that depends on what renters earn.
ZORI tracks new leases, not the average rent paid across all tenants, so it turns roughly a year before the rent component of the local CPI does — which makes it the leading indicator of the two. The real series is deflated by the national CPI-U (all items, NSA) and stated in dollars of the latest month the CPI covers, so it can end a month before the nominal line. Rent is itself part of the CPI, so the real line is rent measured in purchasing power, not rent net of rent inflation.
Sources: Zillow Research, Zillow Observed Rent Index (ZORI), Seattle–Tacoma–Bellevue MSA, smoothed, all homes plus multifamily; U.S. Bureau of Labor Statistics CPI-U, U.S. city average, all items, NSA, via FRED CPIAUCNS. Real values are computed at read time. Auto-generated each build.
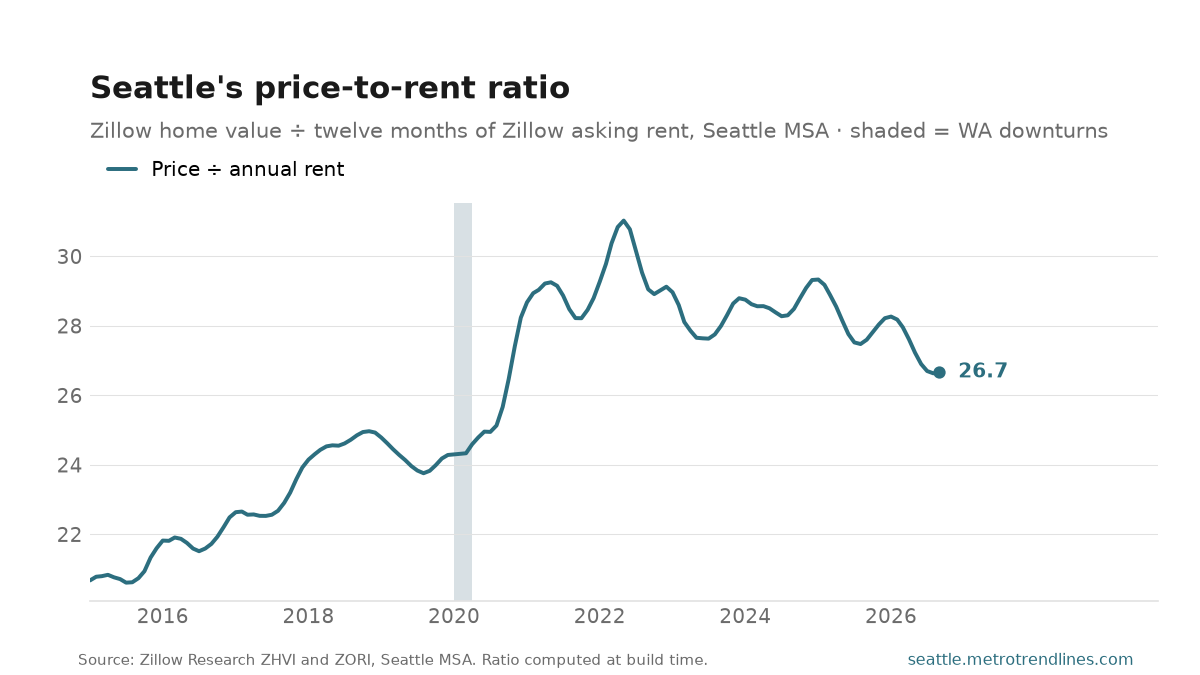
The typical Seattle-area home was worth $720,147 in September 2026, and the typical asking rent was $2,250 a month. Divide the first by a year of the second and you get the price-to-rent ratio: 26.7. A Seattle house costs about 27 years of the rent on it.
It is the cleanest single number for whether housing is expensive relative to itself. Prices and rents are both driven by local incomes and local supply, so when they rise together the ratio holds flat and the market is simply pricier; when prices pull away from rents, buyers are paying for something other than the shelter — expected appreciation, or cheap credit. Nationally a ratio in the high teens is typical. Seattle’s has run from 13.9 (January 2000) to 31.0 (May 2022), and it is 26.7 now, down 3.4% on the year.
Two things it is not. It is not a buy-versus-rent recommendation: that depends on mortgage rates, the tax treatment of the interest, and how long you stay, none of which is in here. And the two legs measure slightly different housing — ZHVI values the whole owner-occupied stock, ZORI tracks asking rents on units coming to market, which skew smaller and newer. The level is therefore approximate; the direction is the signal.
Source: Zillow Research, Zillow Home Value Index and Zillow Observed Rent Index, Seattle–Tacoma–Bellevue MSA. The ratio is ZHVI ÷ (ZORI × 12), computed from the two series at build time rather than stored. Auto-generated each build.
What’s coming on seattle.metrotrendlines.com the week of October 19–23 — 14 posts on the calendar.
Monday, October 19 — Buy or rent: the Seattle ratio, September 2026; Battery or plug-in hybrid, September 2026; Seattle asking rents, September 2026.
Tuesday, October 20 — What a Seattle-area house is worth, September 2026; King County’s electric fleet, September 2026; How long a Seattle home takes to build, September 2026.
Wednesday, October 21 — Seattle wages after inflation, August 2026; Seattle-metro payrolls, August 2026; King County overdose deaths, the 12 months to March 2026.
Thursday, October 22 — Seattle-metro construction jobs, August 2026; Seattle-metro manufacturing jobs, August 2026; Seattle taxable retail sales, Q3 2025.
Friday, October 23 — Washington jobless claims, week of Oct 10, 2026 (pending — its numbers haven’t landed yet); Restaurant and hotel jobs, August 2026.
This is the plan, not a promise. Every weekday post here is tied to a data release, and a release that slips takes its post with it — the post simply waits for the day its numbers land. A figure that arrives early, a revision worth writing about, or an unexpected story out of Seattle can just as easily add a post that isn’t on this list. Expect the week to look roughly like this, and expect at least one day of it not to.
The week of October 12–16 on seattle.metrotrendlines.com, in 11 posts.
Monday, October 12 — Electric vehicles on Washington roads, August 2026. 291,146 electric vehicles were registered in Washington in August 2026, up 11.8% from a year earlier. King County holds 140,695 of them — 48% of the state’s fleet, in a county with about a third of its people.
Monday, October 12 — King County Metro bus ridership, August 2026. King County Metro carried 7,778,139 bus boardings in August 2026, up 2.2% on the year. The peak in this series is 11,328,648 (October 2019), which puts the latest month 31% below it.
Tuesday, October 13 — Seattle offences against persons, August 2026. Seattle police recorded 1,125 offences against persons in August 2026, up 2.7% from a year earlier.
Tuesday, October 13 — Seattle offences against property, August 2026. Seattle police recorded 4,049 offences against property in August 2026, down 9.5% from a year earlier.
Wednesday, October 14 — Sounder commuter rail, August 2026. Sounder carried 176,152 boardings in August 2026, up 4.2% on the year — against a peak of 442,159 in October 2019, which makes it 60% below its high-water mark.
Wednesday, October 14 — Washington State Ferries ridership, August 2026. Washington State Ferries carried 2,335,747 passengers in August 2026, up 1.7% from a year earlier.
Thursday, October 15 — Seattle’s crime rate, August 2026. Seattle recorded 1.37 offences against persons per 1,000 residents in August 2026, and 4.93 offences against property per 1,000.
Thursday, October 15 — Washington business applications, September 2026. Washingtonians filed 11,327 new business applications in September 2026, up 31.4% from a year earlier.
Friday, October 16 — King County’s share of Washington’s EVs, September 2026. 48.2% of Washington’s electric vehicles were registered in King County in September 2026 — 140,379 of the state’s 291,499. The share was 57.0% at its height, in February 2017.
Friday, October 16 — Seattle gas prices, September 2026. The Seattle-area average price of regular gasoline was $5.64 a gallon in September 2026, up 20.0% from a year earlier. After inflation the change is up 15.7% — a year-ago gallon cost $4.88 in today’s money.
Friday, October 16 — Washington jobless claims, week of Oct 10, 2026. Washington workers filed 5,513 initial unemployment claims in the week ending Oct 10, 2026; the steadier four-week average is 4,870, down 18.0% from the same weeks a year ago. Read the chart in two parts.
The week in review: every post from October 12–16, summarised from its own listing blurb and linked. Assembled each Saturday from the posts that actually published that week.