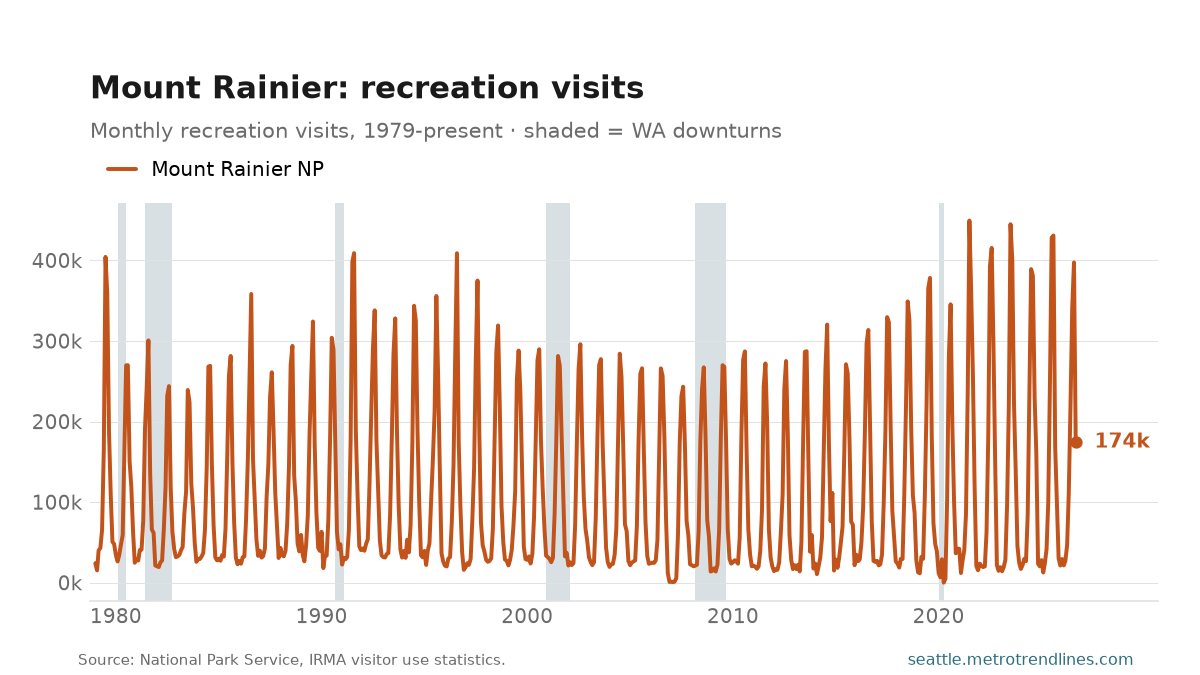
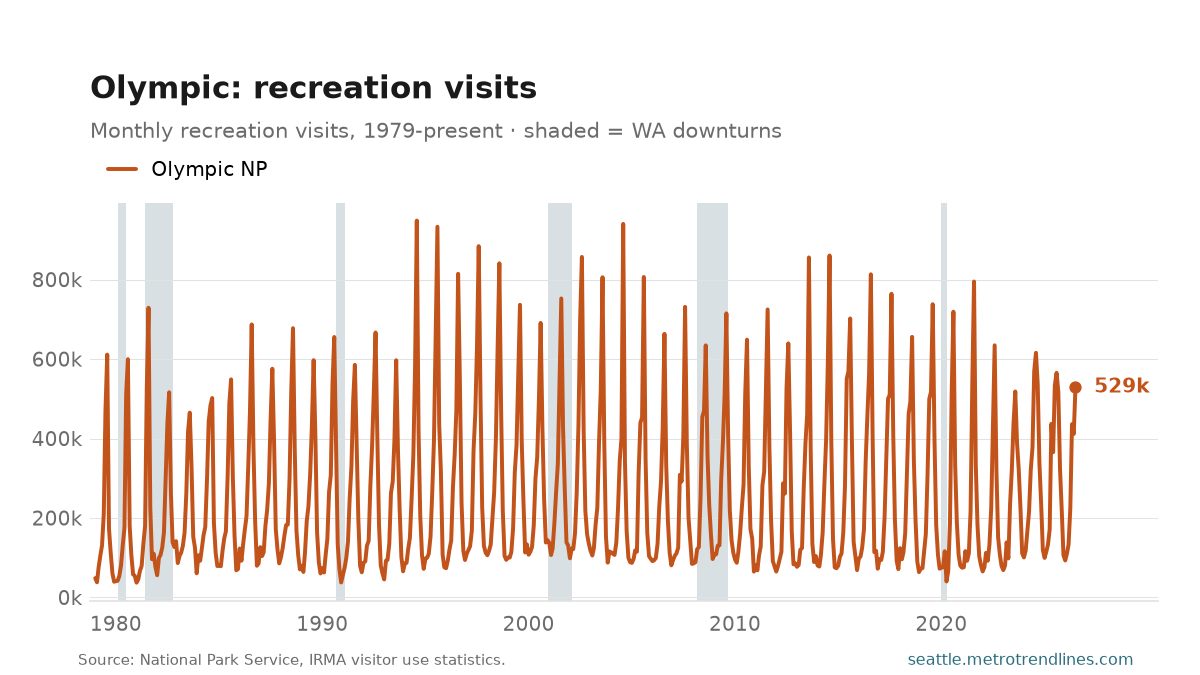
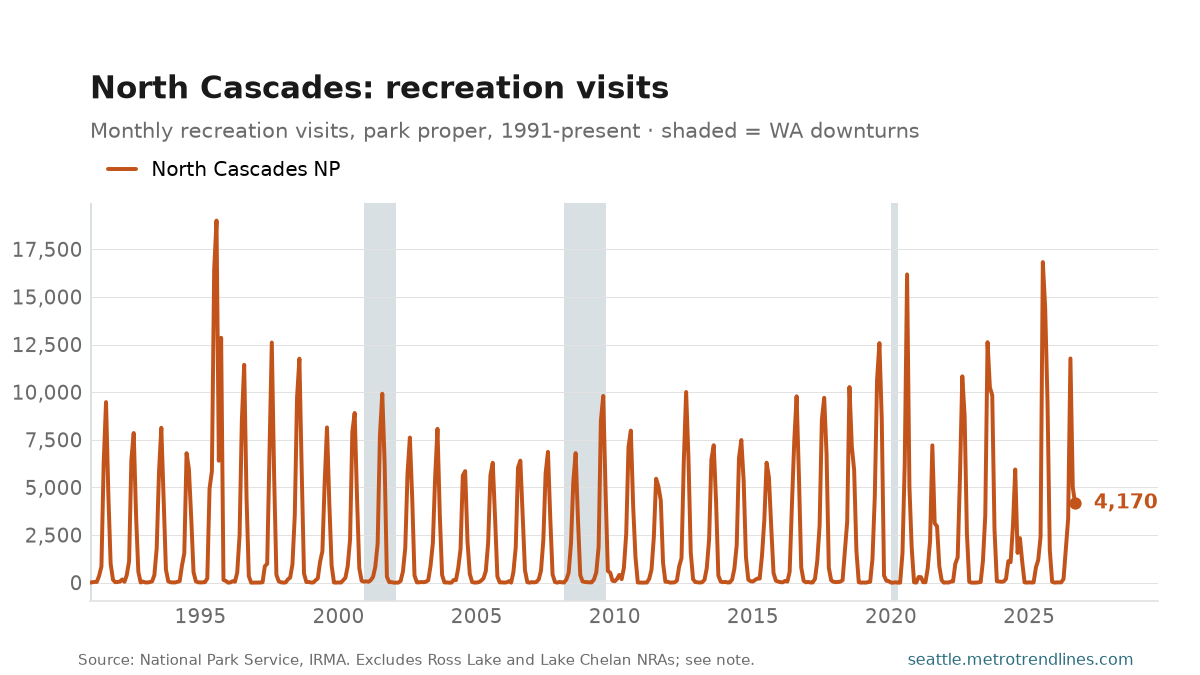
The three national parks within a few hours of Seattle drew 881,708 recreation visits in September 2026: 174,206 at Mount Rainier, 528,764 at Olympic and 4,170 at North Cascades.
Three charts, not three lines. Olympic runs to nearly a million visits in a peak month and North Cascades to about ten thousand — a factor of a hundred — so on shared axes the two smaller parks would be flat against the bottom and only Olympic would be readable. Each park gets its own scale, in order of how many people they see.
The season is most of the signal. These are mountain parks with roads and passes that close, so the year is a spike: Rainier’s record month is 449,446 in July 2021, and its quietest months are two orders of magnitude below that — the record low of 98 in April 2020 is a closed park rather than a quiet one. Nothing here is seasonally adjusted, and the only comparison that means anything is with the same month a year earlier — this month against last month is just the calendar.
North Cascades counts differently after 1990, and its chart starts there. Before 1991 the series carried the whole North Cascades complex, including the Ross Lake and Lake Chelan national recreation areas — which is where nearly all the traffic is, because Highway 20 runs through Ross Lake. Counted that way it was a 600,000-visit park; counted as the park proper it is a 20,000-visit one. Neither number is wrong and the drop between them is not a collapse in visits, so drawing across it would invent a story. A recreation visit is a person entering the park for recreation, not a unique visitor: one person over a long weekend can be several.
Source: U.S. National Park Service, IRMA visitor use statistics, monthly recreation visits to Mount Rainier, Olympic and North Cascades national parks. North Cascades figures are the park proper and exclude the Ross Lake and Lake Chelan national recreation areas, which is why that series steps down after 1990. Auto-generated each build.
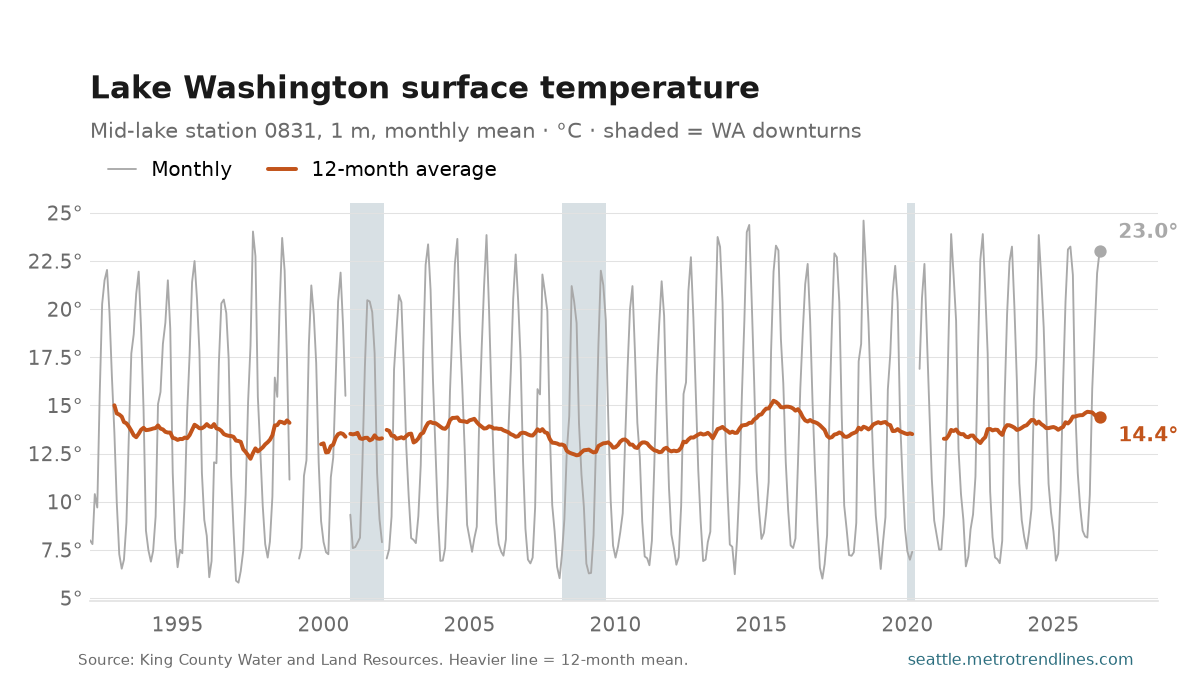
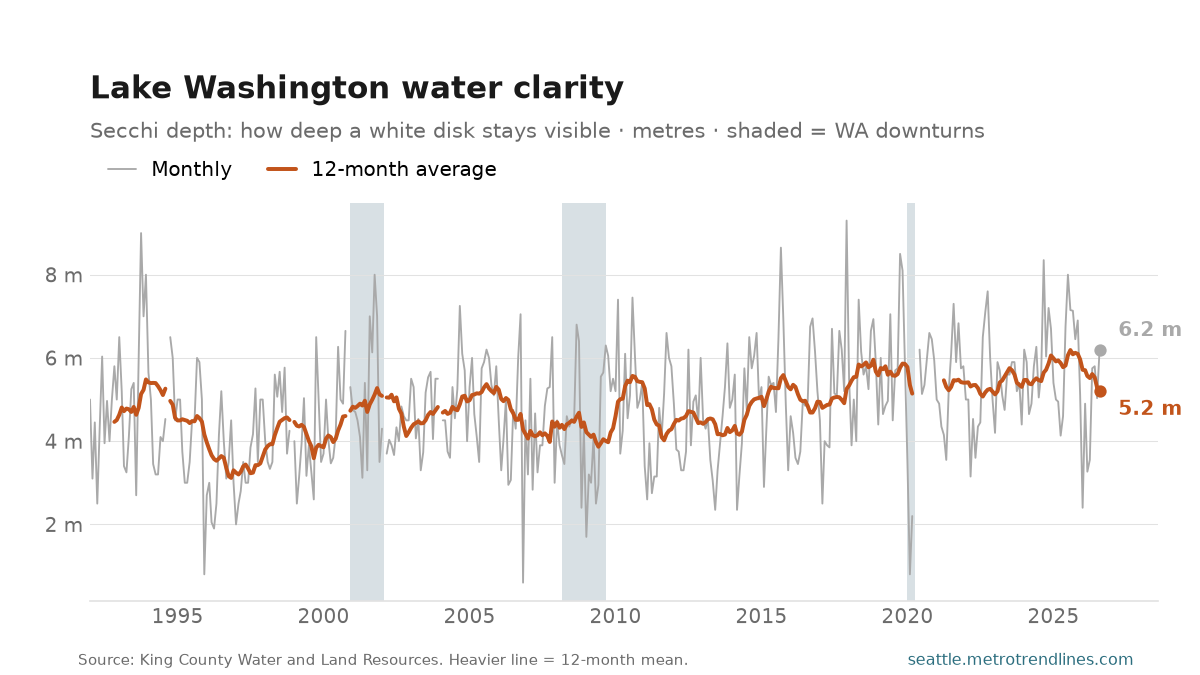
Lake Washington’s surface was 23.0°C (73°F) in August 2026, at King County’s station in the middle of the lake south of the I-90 bridge. The August average since 1992 is 22.2°C; the warmest August was 24.4°C, in 2014.
Clarity. A white disk lowered into the lake stayed visible to 6.2 metres in August 2026, against 7.2 metres a year earlier. Over the last twelve months it averaged 5.2 metres; in the first twelve months of this record, to November 1992, it averaged 4.5.
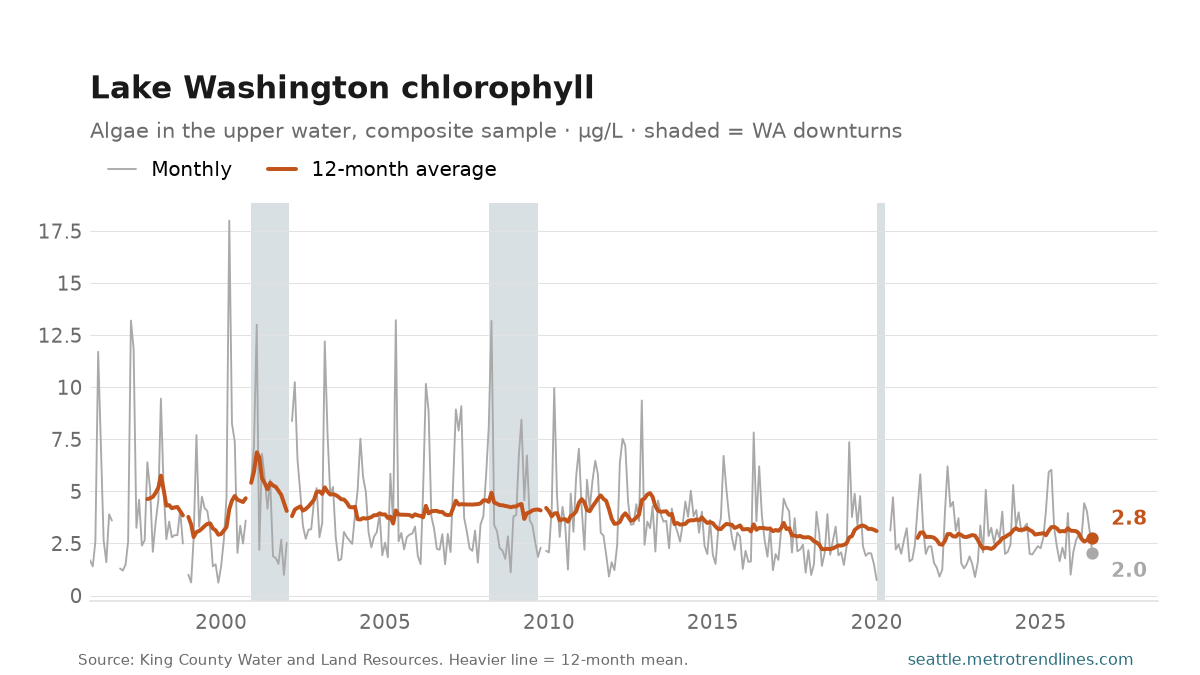
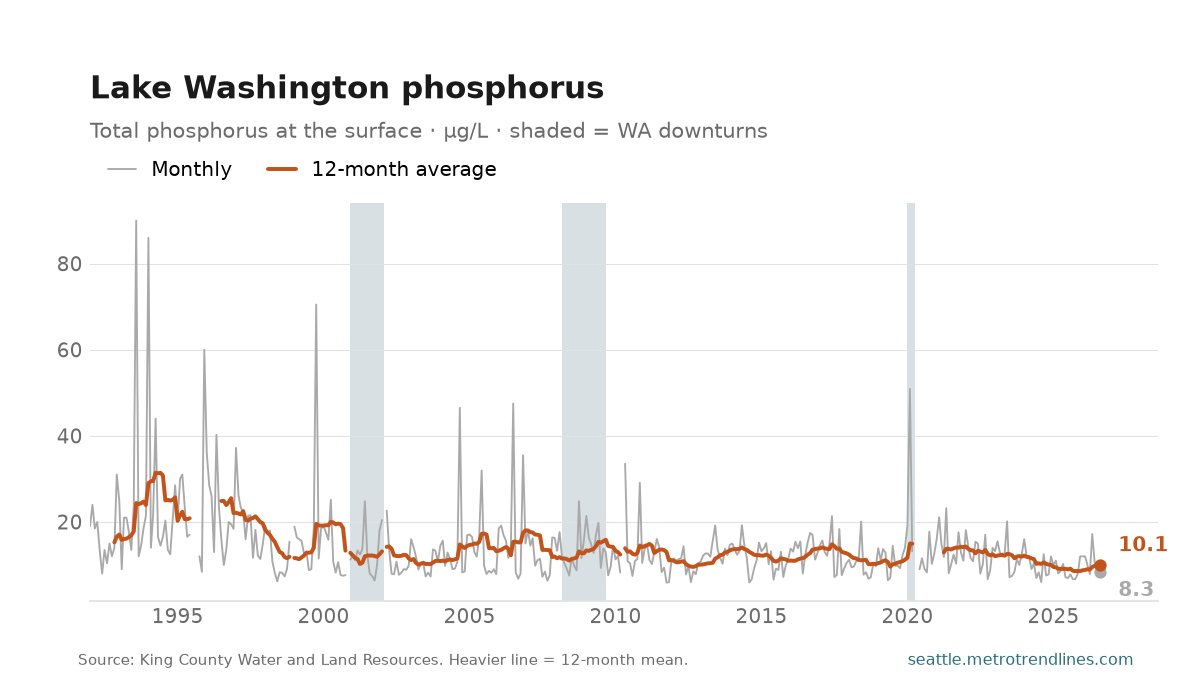
Algae and what feeds them. Chlorophyll, the measure of algae in the upper water, read 2.0 micrograms per litre in August 2026 and has averaged 2.8 over the last year, against 4.6 in the year to October 1997. Phosphorus at the surface has averaged 10.1 micrograms per litre over the last year, against 15.3 in the year to November 1992. Phosphorus is the nutrient that limits algae in this lake, which is why it is on the page.
That is the lake’s history in miniature. In the 1950s and early 1960s treated sewage from a ring of new suburbs ran into Lake Washington, the phosphorus in it fed algae, and the disk vanished at under a metre. Metro diverted the sewage to Puget Sound between 1963 and 1968, and the lake became the textbook recovery. This record starts in 1992, well after it, so what these lines show is what came next.
Each value is the mean of the month’s sampling trips, usually two, at one station. All four series swing with the seasons — the lake is warmest in August, clearest in autumn, and greenest in the spring bloom — so compare a month with the same month in other years, or read the 12-month line. A month with no sampling trip is a gap, not a guess; the station was not sampled at all from 1984 to 1992, which is why the record starts where it does.
Source: King County Water and Land Resources Division, lake water quality data, station 0831; monthly means of each sampling trip, samples flagged questionable or bad excluded. Auto-generated each build.
What’s coming on seattle.metrotrendlines.com the week of October 26–30 — 15 posts on the calendar.
Monday, October 26 — Seattle information-sector employment, September 2026; Lake Washington, August 2026; The three parks, September 2026.
Tuesday, October 27 — Seattle Fire 911 responses, September 2026; Seattle Fire overdose responses, September 2026; Puget Sound, April 2026.
Wednesday, October 28 — Seattle-metro education and health jobs, September 2026; Seattle building permits, August 2026; Seattle-metro professional services jobs, September 2026.
Thursday, October 29 — Seattle-metro finance jobs, September 2026; Seattle-metro trade and transport jobs, September 2026; Washington restaurant and hotel sales, Q3 2025.
Friday, October 30 — Washington jobless claims, week of Oct 17, 2026 (pending — its numbers haven’t landed yet); Seattle-metro government jobs, September 2026; Seattle library checkouts, August 2026.
This is the plan, not a promise. Every weekday post here is tied to a data release, and a release that slips takes its post with it — the post simply waits for the day its numbers land. A figure that arrives early, a revision worth writing about, or an unexpected story out of Seattle can just as easily add a post that isn’t on this list. Expect the week to look roughly like this, and expect at least one day of it not to.
The week of October 19–23 on seattle.metrotrendlines.com, in 14 posts.
Monday, October 19 — Buy or rent: the Seattle ratio, September 2026. The typical Seattle-area home was worth $720,147 in September 2026, and the typical asking rent was $2,250 a month. Divide the first by a year of the second and you get the price-to-rent ratio: 26.7.
Monday, October 19 — Seattle asking rents, September 2026. The typical asking rent in the Seattle metro was $2,250 a month in September 2026, up 1.8% from a year earlier. The second chart takes inflation out.
Monday, October 19 — Battery or plug-in hybrid, September 2026. Washington registered 234,238 battery-electric vehicles and 57,261 plug-in hybrids in September 2026. Batteries are 80% of the state’s electric fleet, and their count is up 11.4% on the year.
Tuesday, October 20 — King County’s electric fleet, September 2026. King County had 115,836 battery-electric vehicles and 24,543 plug-in hybrids registered in September 2026 — batteries are 83% of the county’s electric fleet. The battery count is up 7.7% from a year earlier.
Tuesday, October 20 — How long a Seattle home takes to build, September 2026. Residential building work finished in September 2026 had taken a median of 9.5 months from the day its permit was issued, across 391 completed permits. A year earlier the median was 9.7 months.
Tuesday, October 20 — What a Seattle-area house is worth, September 2026. The typical Seattle-metro home was worth $720,147 in September 2026, down 1.6% from a year earlier.
Wednesday, October 21 — King County overdose deaths, the 12 months to March 2026. 749 King County residents died of a drug overdose in the 12 months to March 2026, by the CDC’s provisional count — down 22.7% from the 12 months to March 2025.
Wednesday, October 21 — Seattle wages after inflation, May 2026. Private-sector workers in the Seattle metro averaged $47.90 an hour in May 2026. Adjusted for inflation that is $48.16 in today’s money, up 2.9% from a year earlier.
Wednesday, October 21 — Seattle-metro payrolls, May 2026. Seattle–Tacoma–Bellevue employers reported 2,137,800 nonfarm jobs in May 2026 (not seasonally adjusted), up 500 — +0.0% — from a year earlier.
Thursday, October 22 — Seattle-metro construction jobs, September 2026. The Seattle metro’s construction and mining employers had 124,400 jobs on payroll in September 2026, up 1.1% from a year earlier. That is 5.8% of all payroll jobs in the metro, against 5.8% a year before.
Thursday, October 22 — Seattle-metro manufacturing jobs, September 2026. Seattle-metro manufacturers employed 167,900 people in September 2026, up 3.3% from a year earlier — 7.8% of all payroll jobs in the metro. The sector peaked at 246,500 jobs in June 1998 and has shed roughly 32% of that since.
Thursday, October 22 — Seattle taxable retail sales, Q3 2025. Seattle businesses made $9.19 billion in taxable retail sales in Q3 2025, up 4.3% from the same quarter a year earlier, and up 1.5% after inflation.
Friday, October 23 — Restaurant and hotel jobs, September 2026. Seattle-metro restaurants, bars, hotels and venues employed 208,400 people in September 2026, up 1.1% from a year earlier — 9.7% of all payroll jobs in the metro. No other series on this site records 2020 as plainly.
Friday, October 23 — Washington jobless claims, week of Oct 10, 2026. Washington workers filed 5,513 initial unemployment claims in the week ending Oct 10, 2026; the steadier four-week average is 4,870, down 18.0% from the same weeks a year ago. Read the chart in two parts.
The week in review: every post from October 19–23, summarised from its own listing blurb and linked. Assembled each Saturday from the posts that actually published that week.
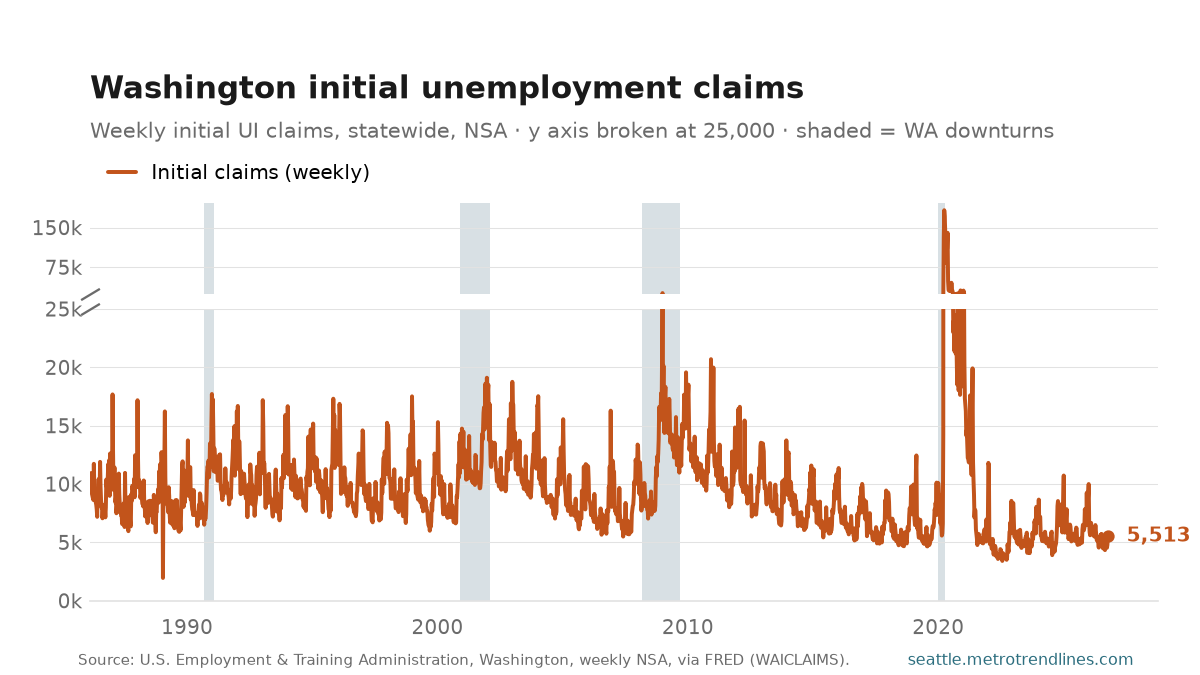
Washington workers filed 5,513 initial unemployment claims in the week ending Oct 10, 2026; the steadier four-week average is 4,870, down 18.0% from the same weeks a year ago.
Read the chart in two parts. The y axis is broken at 25,000. Below the break is where this series lives: almost every week since 1986 is in that band, and on its own scale the normal shape is plain — a spike every winter as construction and seasonal retail lay off, and a sustained rise through 2008-09. Above the break, on a compressed scale, is the spring of 2020, when claims reached 182,849 in the week of Mar 28, 2020. On a single axis that one episode flattens 40 years into a line along the floor.
Claims are the fastest labour-market number there is — a week old when published — and the noisiest. One week is a data point; the four-week average is the reading. Statewide, not seasonally adjusted, so compare with the same weeks a year earlier rather than the week before. The original post is here.
Source: U.S. Employment and Training Administration, initial unemployment-insurance claims for Washington, weekly, not seasonally adjusted, via FRED WAICLAIMS. Auto-generated each build.
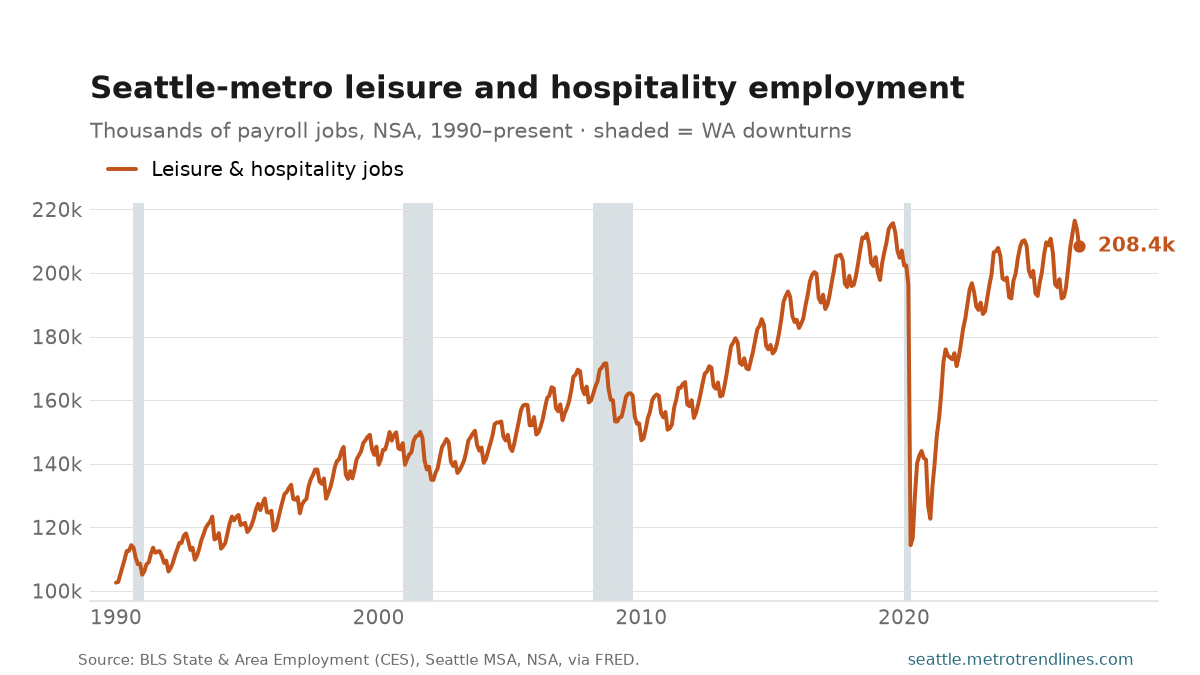
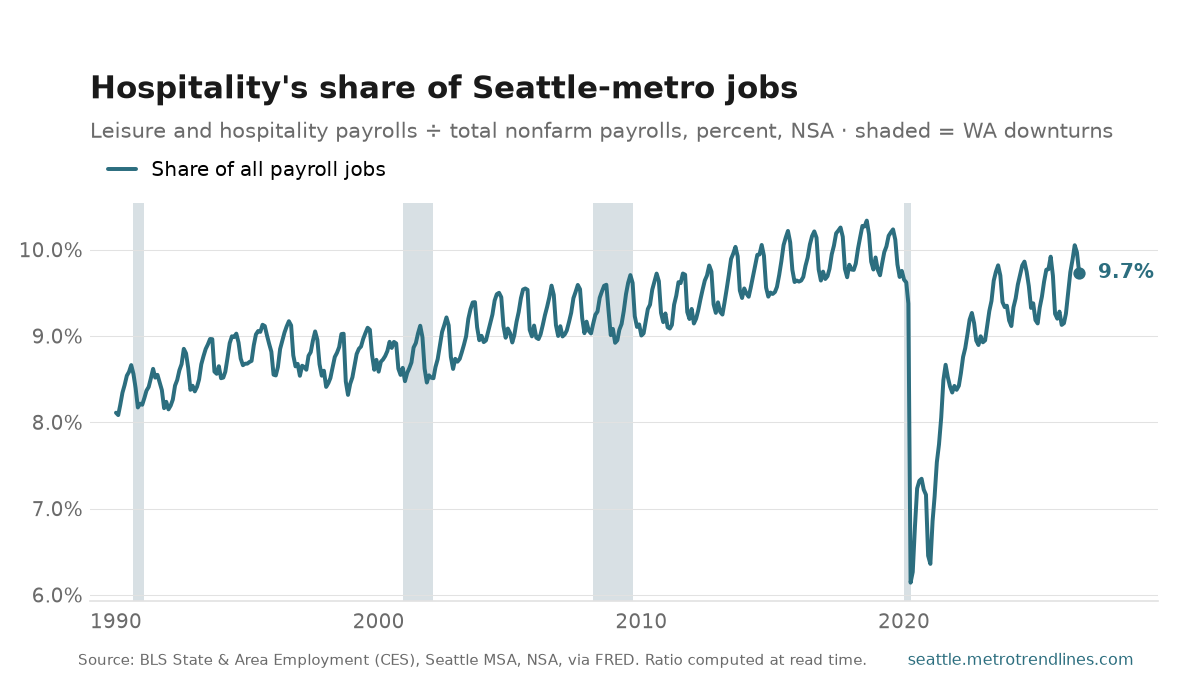
Seattle-metro restaurants, bars, hotels and venues employed 208,400 people in September 2026, up 1.1% from a year earlier — 9.7% of all payroll jobs in the metro.
No other series on this site records 2020 as plainly. Employment in this sector fell from 202,400 in February 2020 to 114,400 in April 2020 — a drop of 43%, inside two months, in an industry that cannot be done from home — and its share of the region’s jobs fell to 6.1%. Everything to the right of that notch is the recovery.
The share chart is the longer story. As the part of the region’s work done in factories fell, the part done serving people rose — from 8.1% when the series opens in January 1990 to a peak of 10.3% in August 2018. That is a real change in what a Seattle job is, and not a neutral one: these are the jobs least likely to cover what the rent takes.
Not seasonally adjusted, and summer is genuinely the busy season here, so compare with the same month a year earlier. The share is computed at read time from the same BLS release as the count.
Source: U.S. Bureau of Labor Statistics, State & Area Employment, leisure and hospitality and total nonfarm payrolls, Seattle–Tacoma–Bellevue MSA, not seasonally adjusted, via FRED. The share is derived at read time. Auto-generated each build.
Corrected 2026-10-24: this post first said employment fell to 102,600 in January 1990 — the lowest month in the whole series, not the 2020 low. The figures above are now the 2020 low.
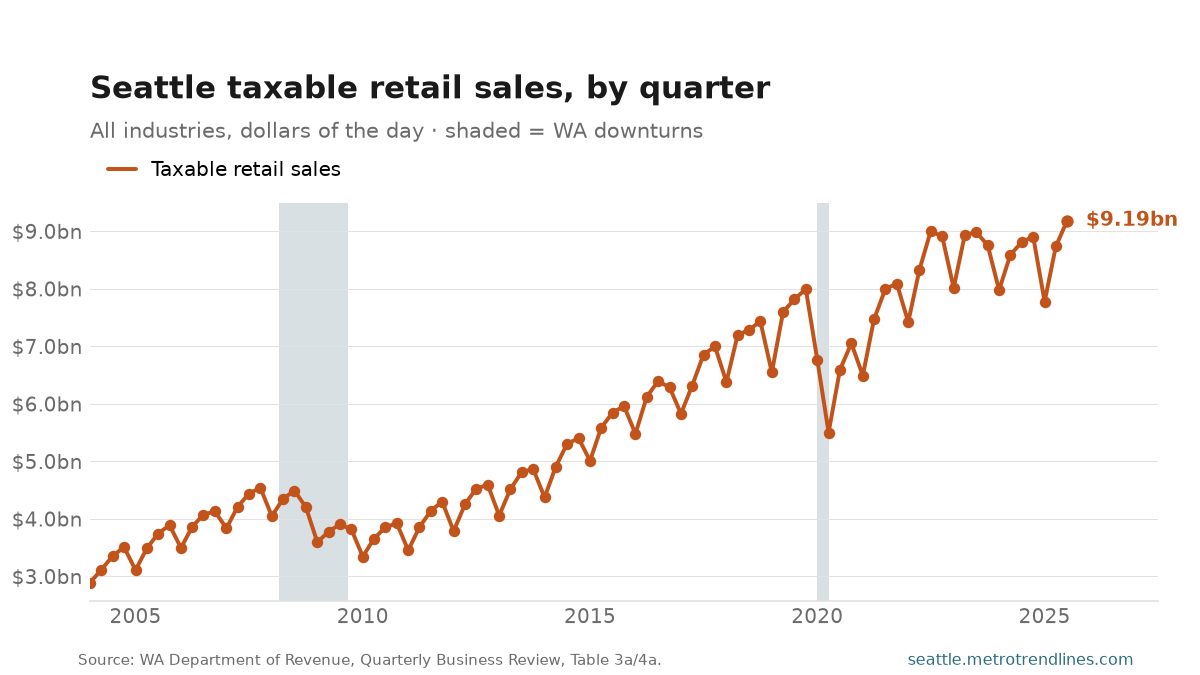
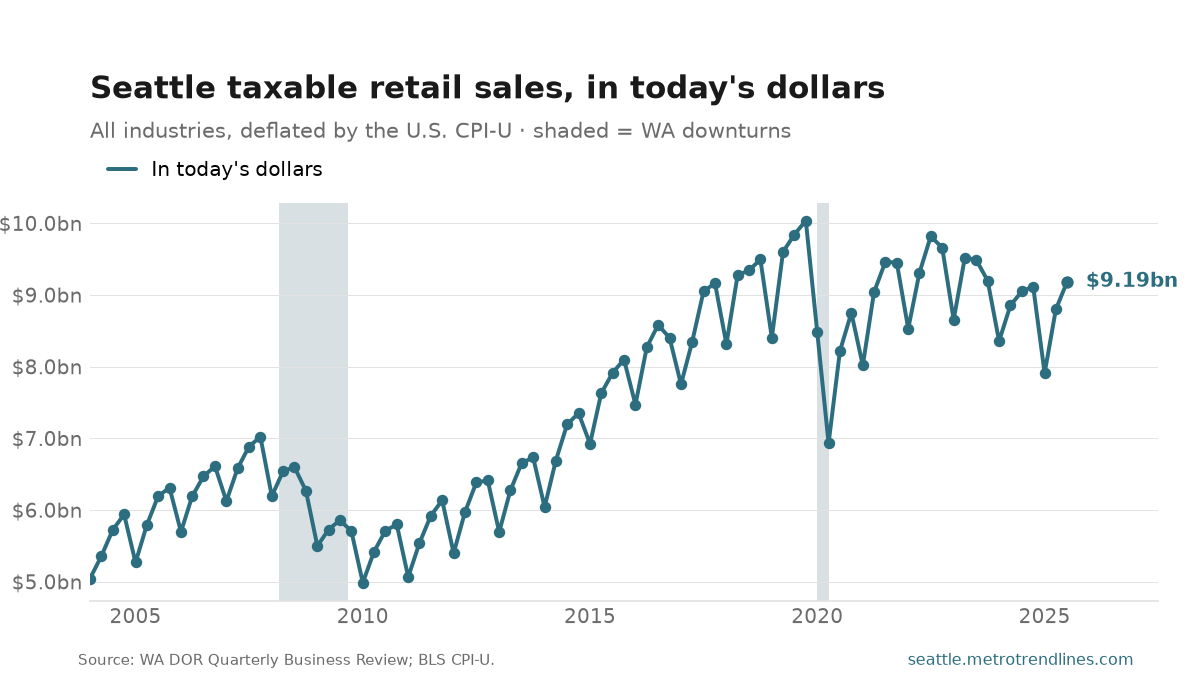
Seattle businesses made $9.19 billion in taxable retail sales in Q3 2025, up 4.3% from the same quarter a year earlier, and up 1.5% after inflation. In July 2025 dollars the record quarter is $10.04 billion, in Q4 2019, and Q3 2025 is 8% below it.
Taxable retail sales are not all spending. They are what the sales tax applies to: most goods, restaurant meals, hotel rooms — and construction, which is why a building boom lifts the city’s total. Groceries and most services are exempt, so a household that spends more on rent and less on furniture shows up here as a fall. And when the state taxes something new, as it did from October 2025 with some services, the line rises with no change in what anyone bought.
Compare a quarter with the same quarter a year earlier, not the one before: the fourth quarter carries the holidays every year. The Department of Revenue publishes a quarter four to six months after it ends, from businesses’ own excise tax returns, so this post runs four times a year. The same report carries Washington’s restaurant and hotel sales, which have a post of their own.
Source: Washington State Department of Revenue, Quarterly Business Review, Table 3a/4a, taxable retail sales for the city of Seattle, all industries; deflated by the U.S. CPI-U. Auto-generated each build.
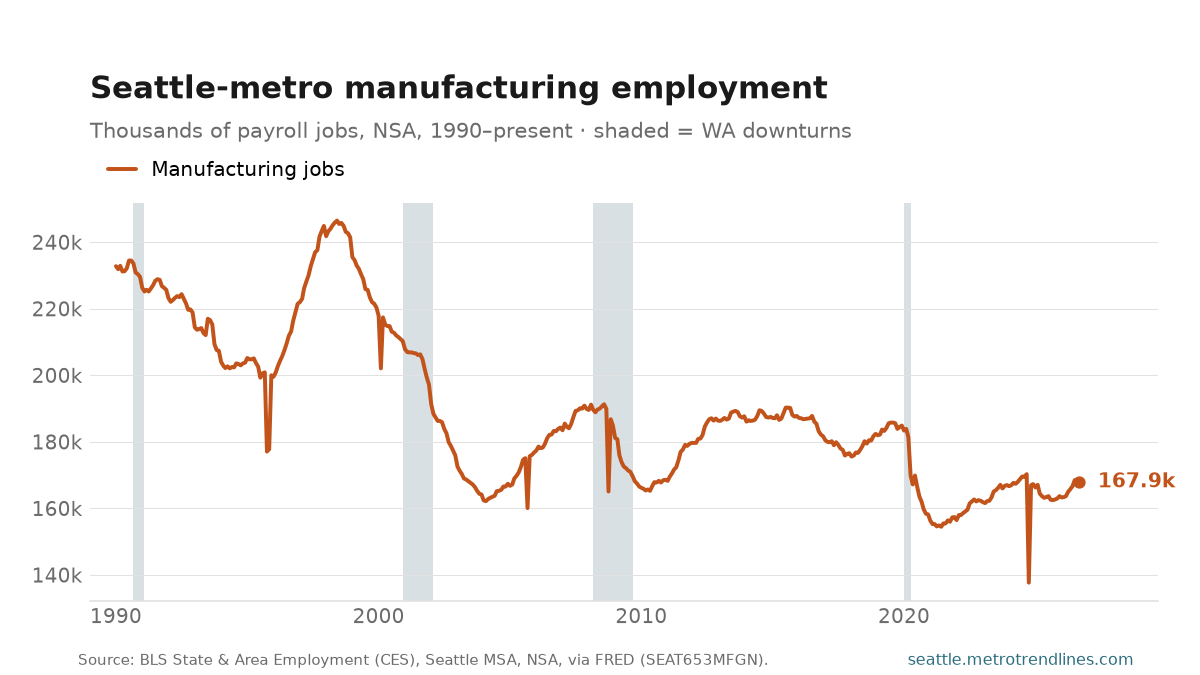
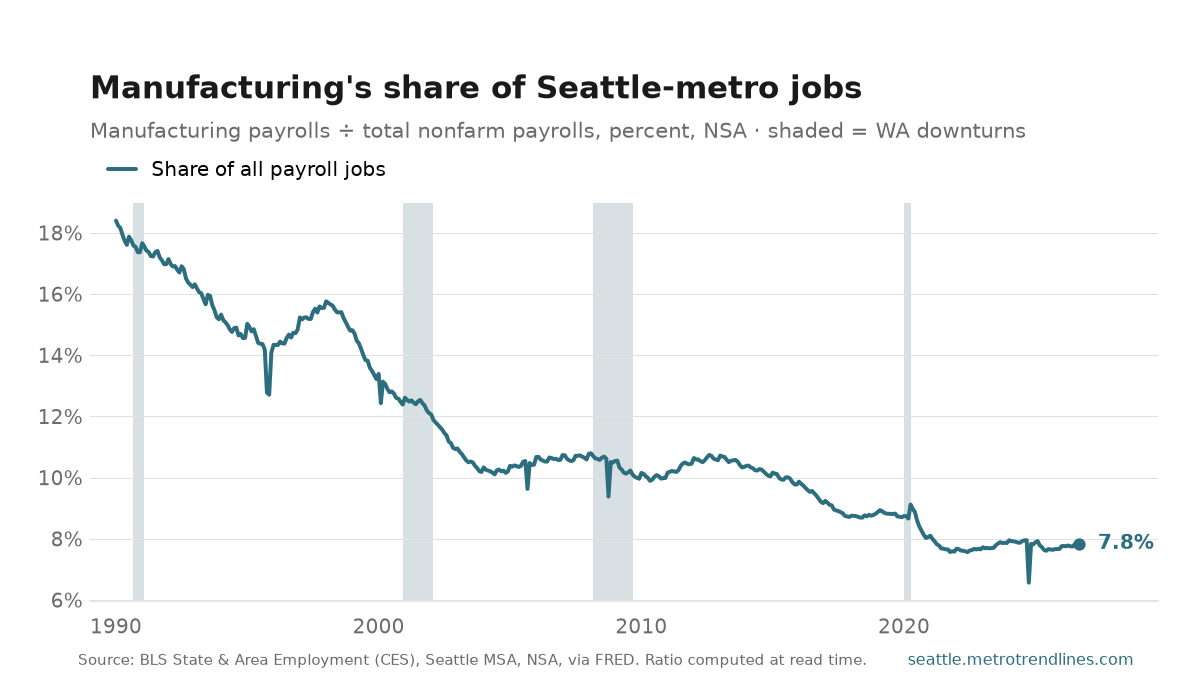
Seattle-metro manufacturers employed 167,900 people in September 2026, up 3.3% from a year earlier — 7.8% of all payroll jobs in the metro. The sector peaked at 246,500 jobs in June 1998 and has shed roughly 32% of that since.
The second chart is the more damning one. The share fell from 18.4% in January 1990 to 7.8% now — far faster than the head count, because the rest of the metro’s economy grew while this sector shrank. Both together are why an industry that once shaped the region’s politics now moves its headline employment number hardly at all.
In this region manufacturing is very close to a Boeing series with a rounding error attached, which is why the deep single-month notches in both charts line up with machinist strikes rather than with recessions — the data is not seasonally adjusted, so a walkout shows up whole. Reading them as anything else is the standard mistake with this chart.
Numerator and denominator of the share come from the same BLS release for the same metro, so it stays consistent when the levels are revised; it is computed at read time, never stored.
Source: U.S. Bureau of Labor Statistics, State & Area Employment, manufacturing and total nonfarm payrolls, Seattle–Tacoma–Bellevue MSA, not seasonally adjusted, via FRED. The share is derived at read time. Auto-generated each build.
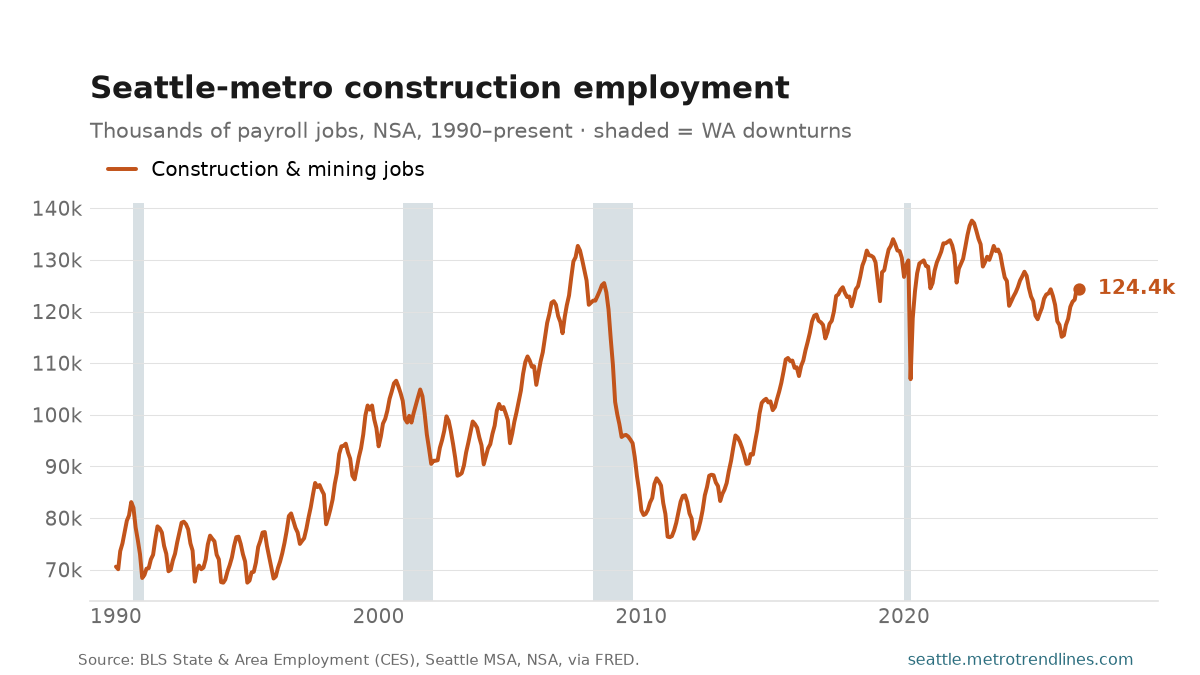
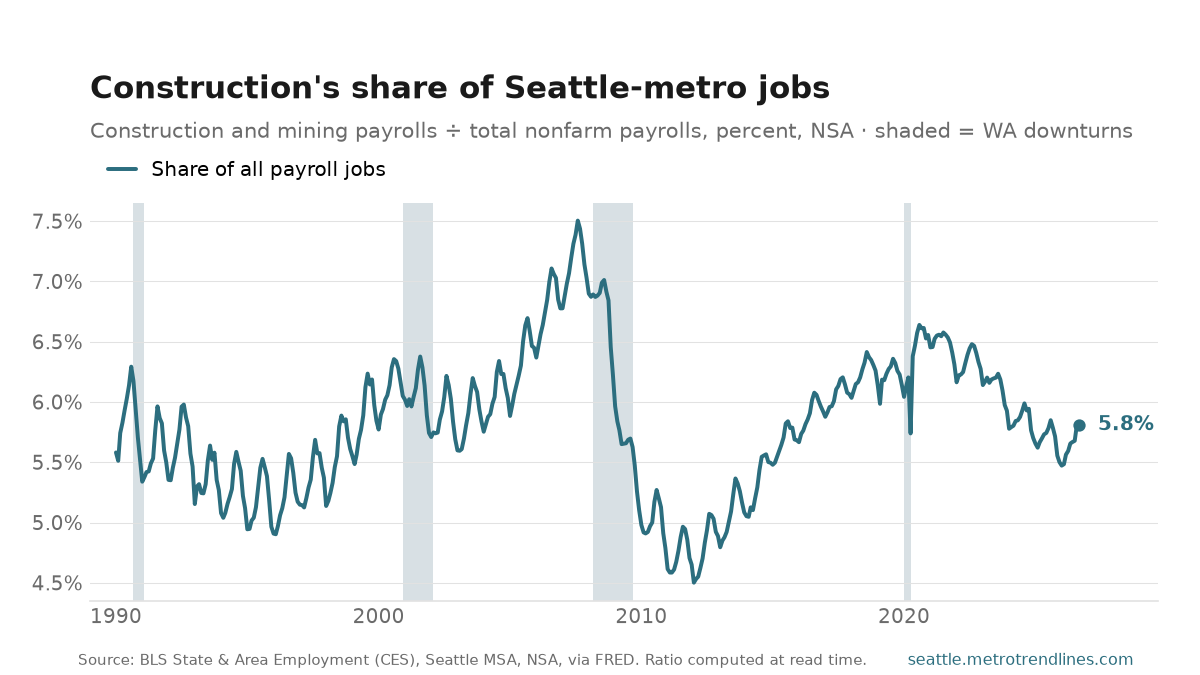
The Seattle metro’s construction and mining employers had 124,400 jobs on payroll in September 2026, up 1.1% from a year earlier. That is 5.8% of all payroll jobs in the metro, against 5.8% a year before.
Construction is the most cyclical sector the site tracks and the one that turns first: the crash after 2007 took roughly a third of these jobs out before the wider downturn had properly arrived. The share chart shows it without the flattery of a growing economy — it peaked at 7.5% in August 2007 and bottomed at 4.5% in January 2012, a measure of how much of the region’s labour is pointed at building anything.
It has a real summer season in the raw data, so — as everywhere in these NSA series — the year-over-year change is the number that means something and a fall from August to January is just weather. It sits alongside building permits as this site’s two reads on whether Seattle is building: permits lead; payrolls are what actually happened. The share is computed at read time from the same BLS release as the count.
Source: U.S. Bureau of Labor Statistics, State & Area Employment, mining, logging and construction and total nonfarm payrolls, Seattle–Tacoma–Bellevue MSA, not seasonally adjusted, via FRED. The share is derived at read time. Auto-generated each build.
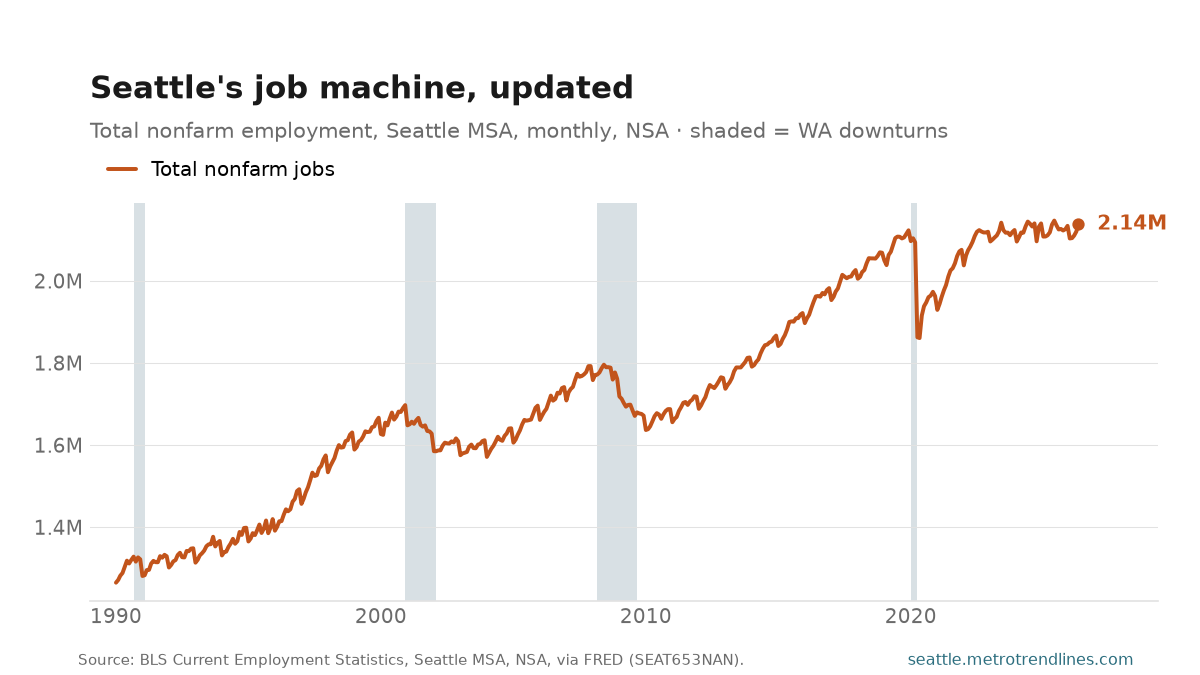
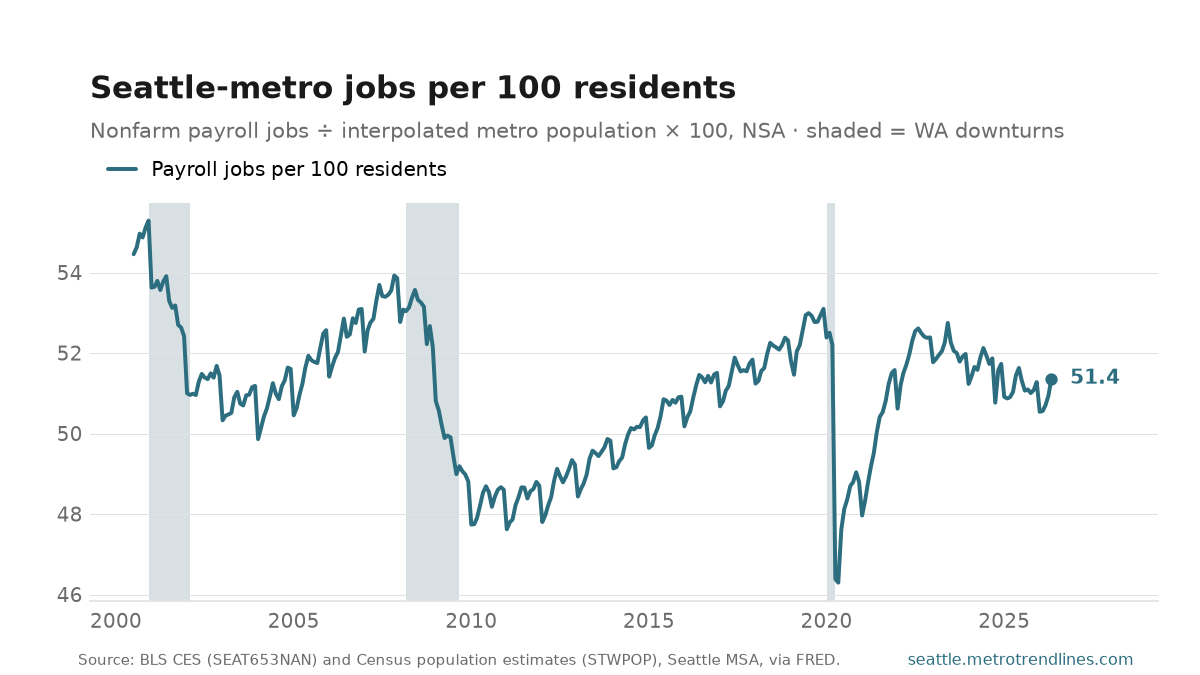
Seattle–Tacoma–Bellevue employers reported 2,137,800 nonfarm jobs in May 2026 (not seasonally adjusted), up 500 — +0.0% — from a year earlier. Set against everyone who lives in the metro, that is 51.4 payroll jobs for every 100 residents, against 51.4 a year before.
The second chart is there because a count of jobs always grows in a growing region. Jobs per resident does not have to: it peaked at 55.3 in December 2000, fell to 46.3 in May 2020, and says whether the job machine is keeping up with the people arriving to use it.
It is not the employment rate, and the difference matters. The official rate counts people with work, by where they live, as a share of adults. This counts jobs at employers in the metro — a second job counts twice, and someone commuting in from outside the metro counts here — divided by every resident, children and retirees included. So an ageing population pulls it down with no change in the job market. Read the direction, not the level.
The population is the Census Bureau’s July 1 estimate for the same three-county metro, interpolated between years; the chart starts in 2000 because that is where the annual estimates on FRED begin. Because payrolls aren’t seasonally adjusted, the year-over-year change is the one to watch — this is the monthly refresh of the stalled job machine.
Sources: U.S. Bureau of Labor Statistics, Current Employment Statistics, Seattle–Tacoma–Bellevue MSA, not seasonally adjusted, via FRED SEAT653NAN; U.S. Census Bureau resident population estimates for the same MSA, via FRED STWPOP, interpolated to monthly. The ratio is computed at read time. Auto-generated each build.