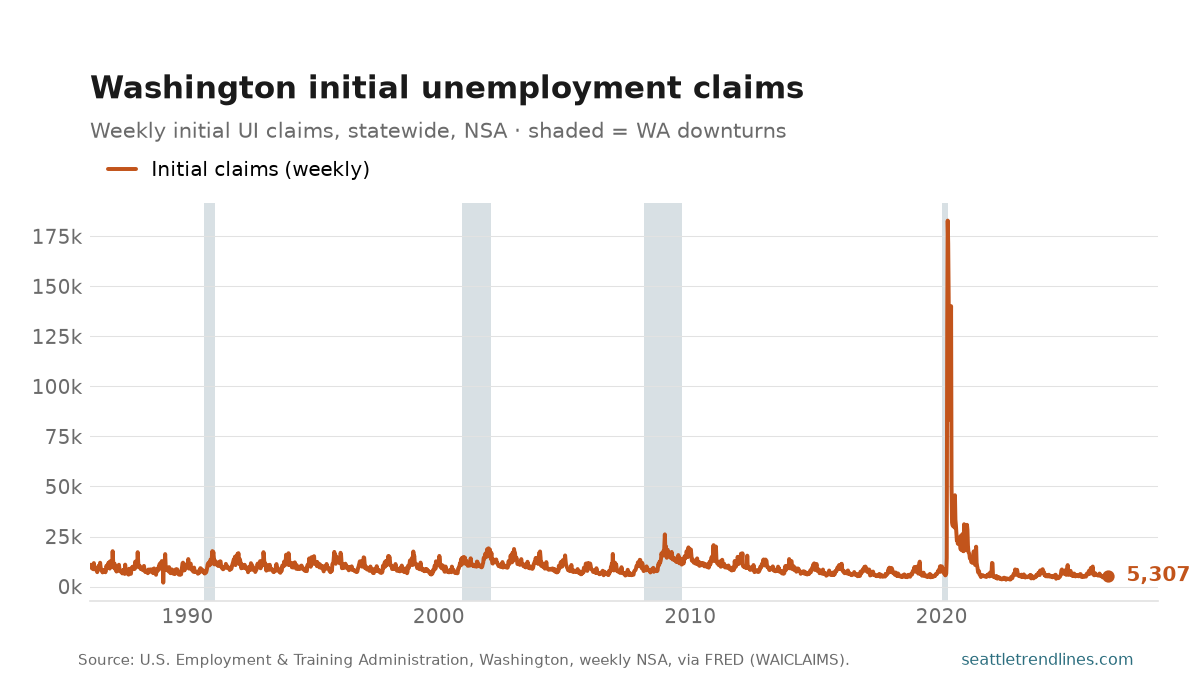
Washington workers filed 5,307 initial unemployment claims in the week ending Aug 8, 2026; the steadier four-week average is 4,749, down 5.9% from a year ago. Statewide, weekly, not seasonally adjusted — the update to the jobless-claims post.
Source: U.S. Employment and Training Administration, initial unemployment-insurance claims for Washington, weekly, not seasonally adjusted, via FRED WAICLAIMS. Auto-generated each build.
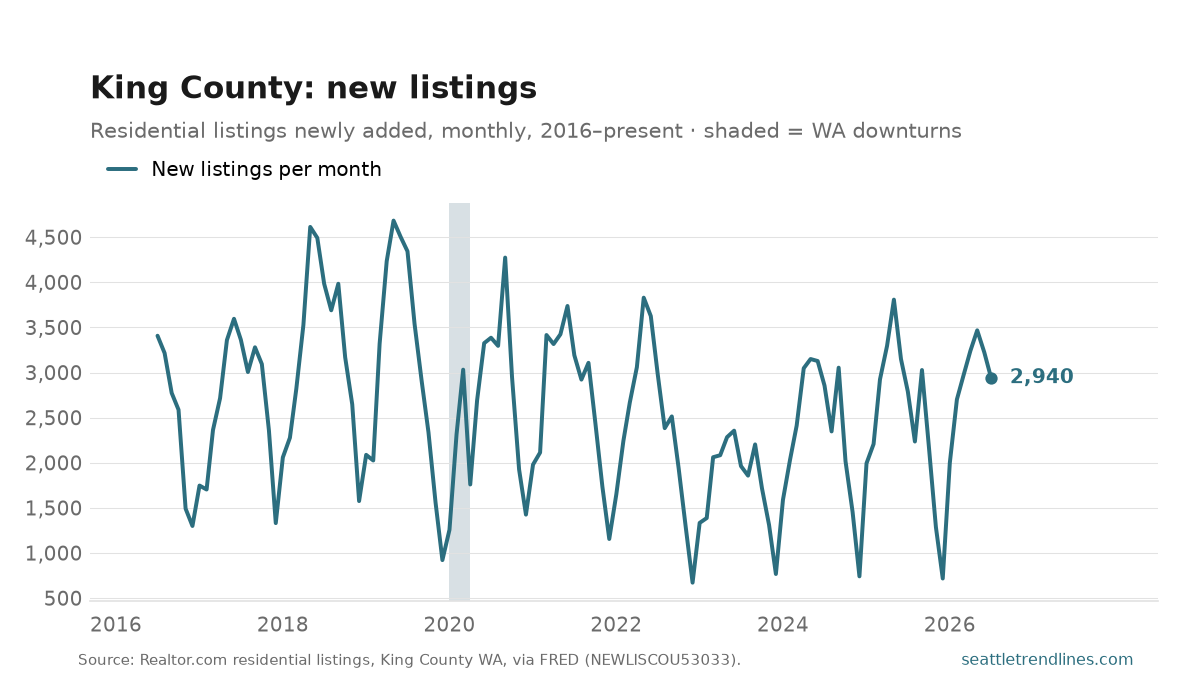
King County sellers listed 2,940 homes in July 2026, up 5.4% from a year earlier. The series has run from 672 in December 2022 to 4,684 in May 2019.
New listings are the supply side of the inventory number, and they are the half that says something about behaviour. Active inventory is a stock — what is sitting there — and it can rise either because more people are selling or because fewer people are buying. New listings are a flow, and only sellers control it. When the two diverge, the story is demand.
The sawtooth is severe here and it is not noise: listing a house is a spring activity in this market, so the year-over-year comparison is the only one that means anything. Nothing here is seasonally adjusted.
Source: Realtor.com residential listings, King County WA (FIPS 53033), via FRED NEWLISCOU53033. Auto-generated each build.
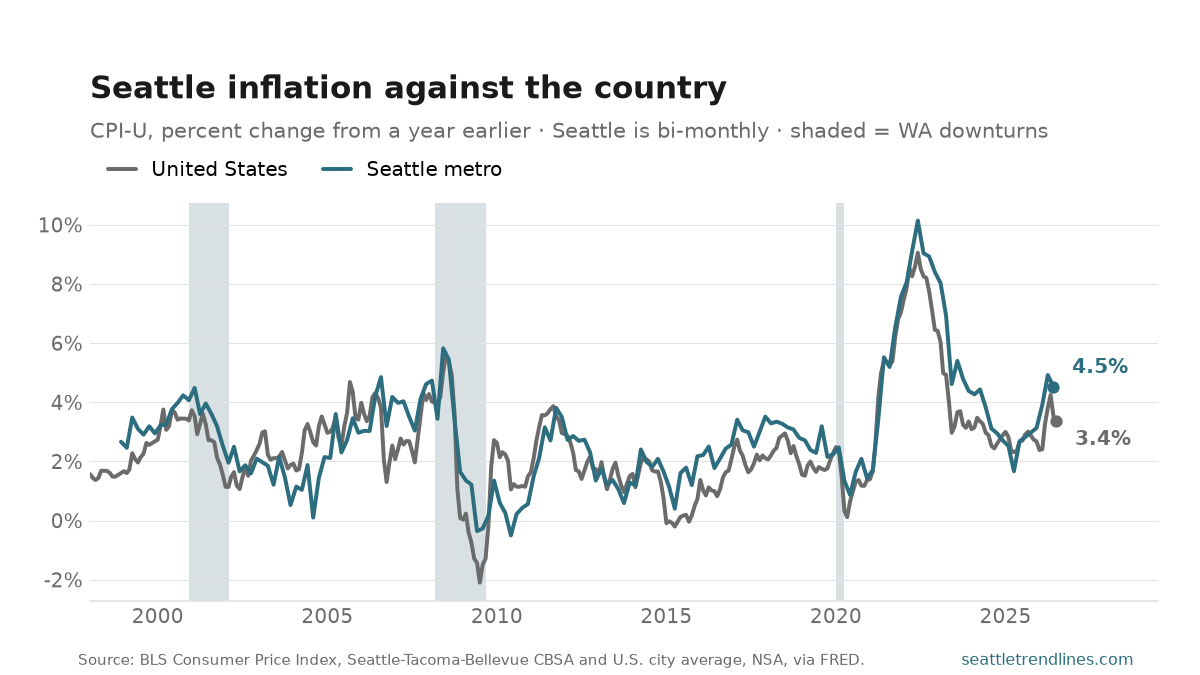
Prices in the Seattle metro were 4.5% higher than a year earlier in June 2026. Nationally the figure was 3.4% — a gap of 1.2 points, with Seattle running hotter.
The two lines mostly move together, because most of what drives inflation is national — energy, cars, the money supply. What separates them is housing. Shelter is roughly a third of the basket, it is the most local component in it, and Seattle’s has spent most of the last fifteen years rising faster than the country’s. When this region runs ahead of the national rate, that is usually what you are looking at, which is why asking rents lead this series by about a year.
Since 1998 Seattle’s rate has ranged from -0.5% (June 2010) to 10.1% (June 2022), which is the span this chart covers. One mechanical caveat: BLS publishes the Seattle index every other month, while the national one is monthly, so the local line has half as many points and the freshest national reading may be a month newer than the freshest local one.
Source: U.S. Bureau of Labor Statistics, Consumer Price Index for All Urban Consumers, Seattle–Tacoma–Bellevue CBSA (published bi-monthly) and the U.S. city average, not seasonally adjusted, via FRED. Auto-generated each build.
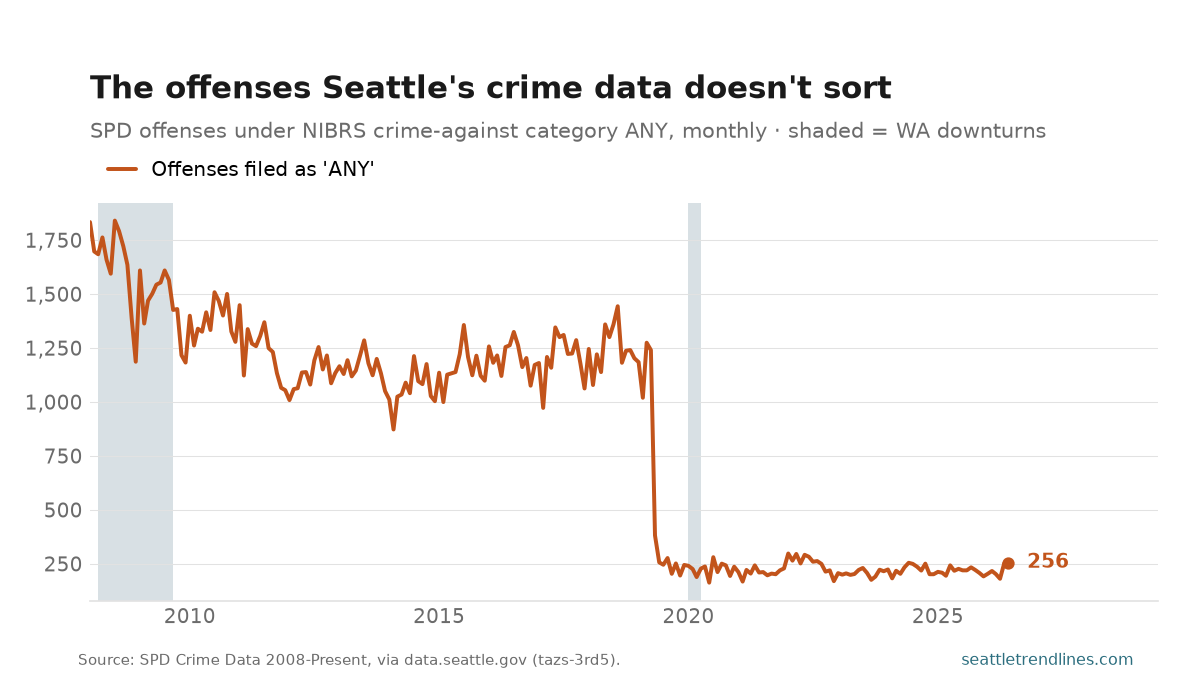
Seattle police filed 257 offenses under the category ANY in June 2026 — neither a crime against a person, nor against property, nor against society, which are the three NIBRS is supposed to sort every offense into. That is 4.5% of the 5,748 offenses in the month’s total. In January 2008, where the record starts, the same category carried 1,834 offenses — 26% of that month.
The fall between those two numbers is not a change in crime, and this is the one thing the chart is for: SPD migrated to a new records system in 2019, and the uncategorised residue collapsed with it. Nothing was solved and nothing stopped happening — the same offenses started arriving with a category attached. It is the clearest picture on this site of why the crime posts say not to read a trend across 2019.
The bucket is counted, not dropped: across the whole record it is about an eighth of all offenses, and a fifth of them in the early years, so throwing it away would quietly cut the headline. It goes into the total here and in SPD’s. Offenses are dated by when the offense started rather than when the report was written, so the newest month in the file is always a little short and revises up.
Source: Seattle Police Department, SPD Crime Data 2008-Present, via data.seattle.gov (Socrata tazs-3rd5), offenses whose nibrs_crime_against_category reads ANY, dated by offense date. Counts crime reported to police. Bench post — generated from the latest observation in the site database.
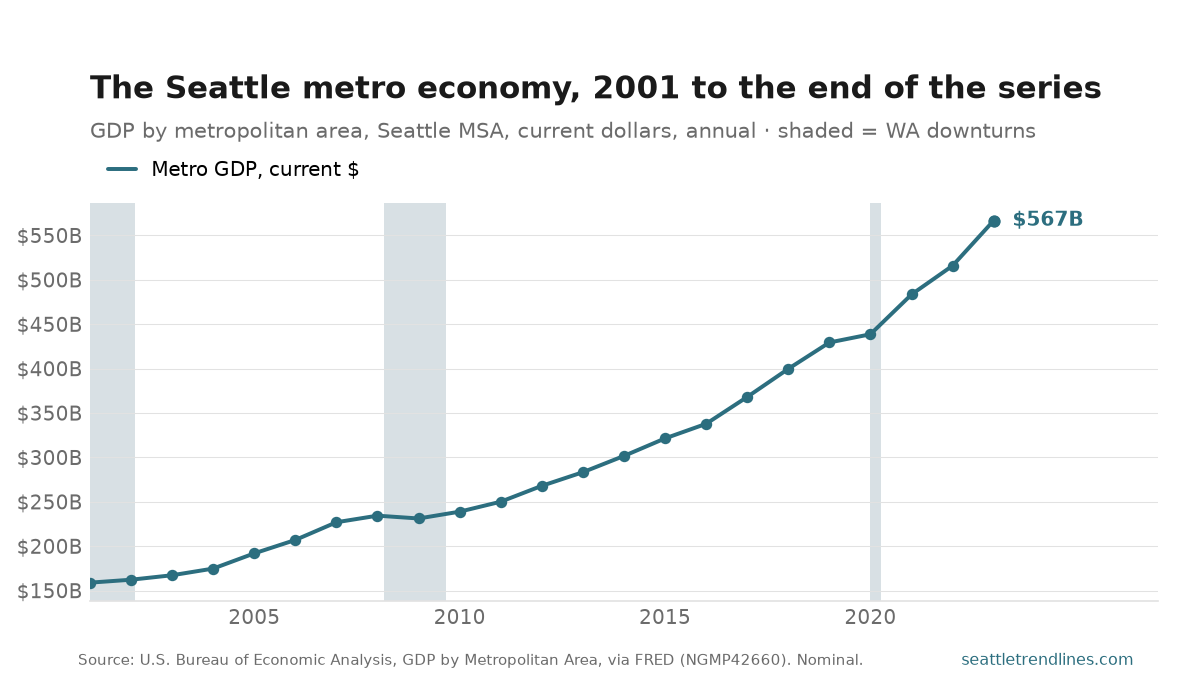
Everything produced in the three-county Seattle metro came to $567 billion in 2023, up 9.8% on the year. That is 256% more than the $159 billion the same three counties produced in 2001.
These are current dollars, not inflation-adjusted ones, so a good part of that climb is the dollar getting smaller rather than the region making more — the same caveat the gas-price post turns on. What the nominal line does show cleanly is where output actually stopped: one down year, in 2009, and a 2020 that barely moved. Seattle’s pandemic year cost the region a year of growth, not the level itself.
The geography is the Seattle–Tacoma–Bellevue MSA — King, Snohomish and Pierce counties, the same three the payroll series covers — so this is the regional economy, not the city’s. It also stops: BEA discontinued the metro-level series, which is why the line ends where it does and why there is no monthly update post behind it.
Source: U.S. Bureau of Economic Analysis, GDP by Metropolitan Area, all-industry total for the Seattle–Tacoma–Bellevue WA MSA (CBSA 42660), via FRED NGMP42660, millions of current dollars. BEA has discontinued the metro-level series; 2023 is the final official year. Bench post — generated from the latest observation in the site database.
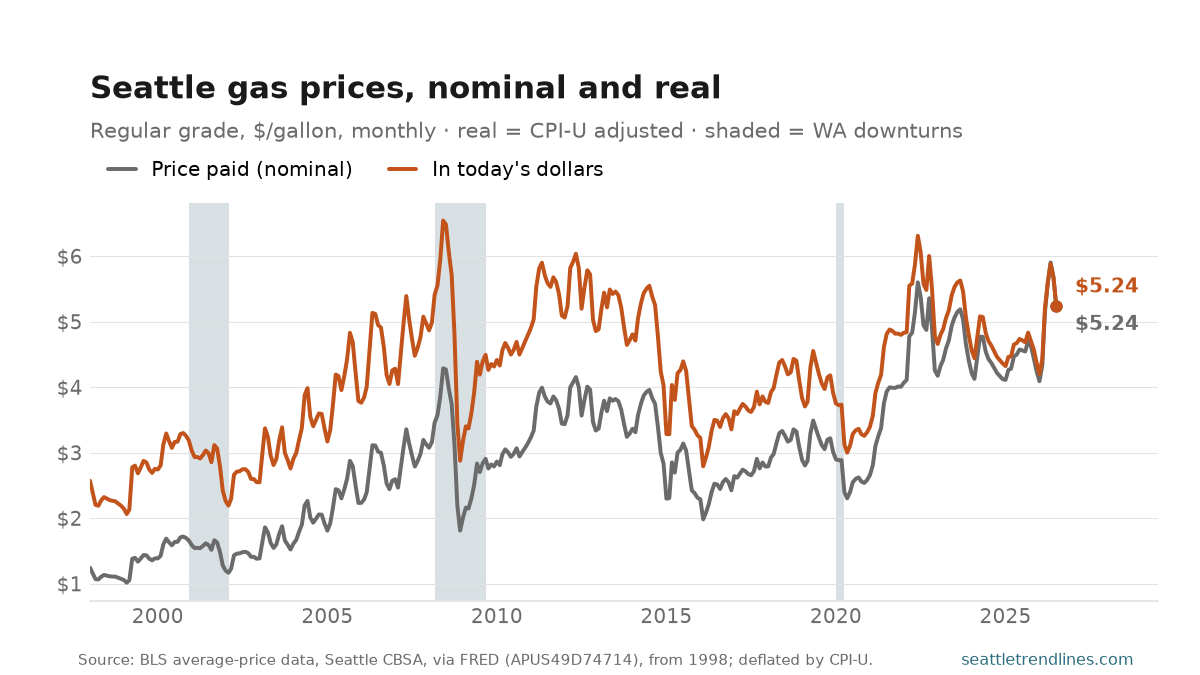
A gallon of regular cost $5.24 at the Seattle pump in July 2026. The series is deflated to the latest month, so that is also this month’s figure in today’s money; what moves is what the old prices are worth. A year ago’s gallon comes to $4.73 in today’s dollars, which puts this month up 11.1% in real terms.
The gap between the two lines is the whole post. The nominal line keeps setting records because dollars keep getting smaller; the real line says whether a tank of gas is actually taking more out of a Seattle paycheck than it used to. Measured that way the record is $6.56, set in June 2008 — today’s price is 20% below it. The cheapest gas of the series, in the same money, was $2.07 in February 1999. The record-at-the-pump post made that comparison at May’s high; this is the same pair of lines a couple of releases on.
Deflated with the CPI-U, so “today’s dollars” means the latest period the price index covers. Prices are a monthly average for the Seattle CBSA, not a spot price at any one station, and Washington’s fuel taxes and its clean-fuel standard are inside the number — this is what people paid, not what the crude cost.
One gap in the record: BLS collected this price for Seattle from 1978, stopped in the late 1980s, and only resumed in January 1998. The chart starts where the series resumes rather than drawing a straight line across the missing decade.
Source: U.S. Bureau of Labor Statistics average-price series, regular unleaded gasoline, Seattle CBSA, via FRED APUS49D74714, drawn from the January 1998 resumption — BLS published no Seattle price between the late 1980s and then. Real series deflated by CPI-U to the latest available period. Auto-generated each build.
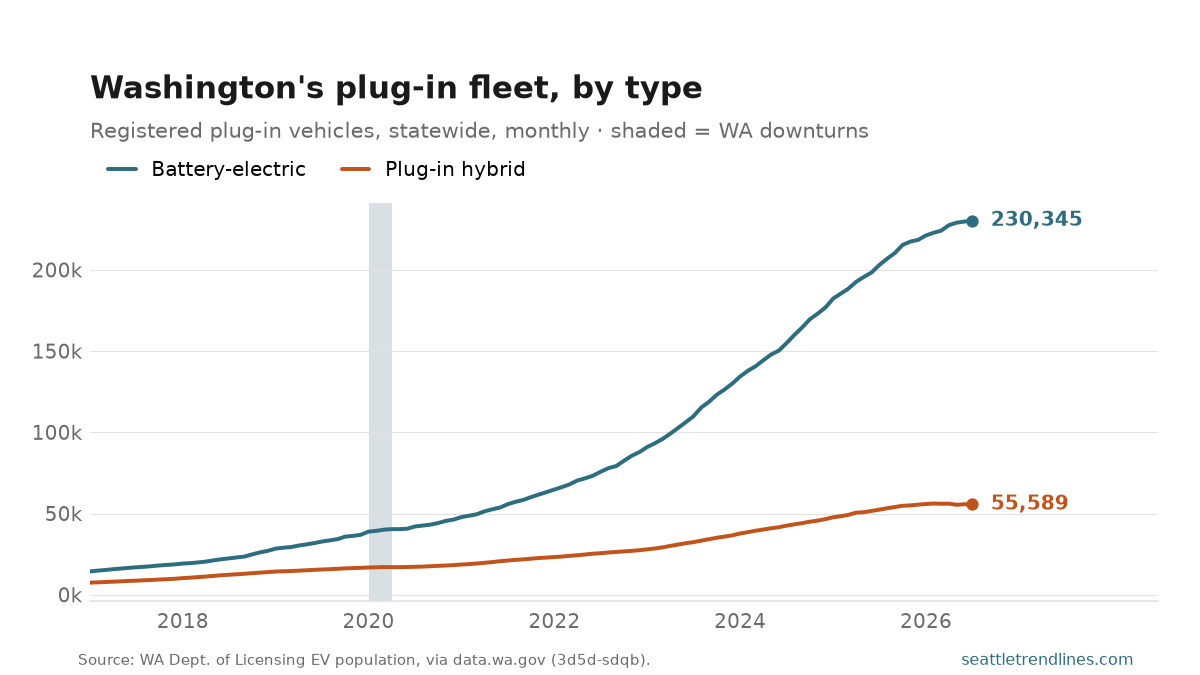
Washington had 235,196 battery-electric vehicles registered in July 2026, up 15.9% on the year, and 57,080 plug-in hybrids, up 8.3%. Pure battery cars are 80% of the state’s plug-in fleet.
The EV post charts those two added together. Split apart they answer a question the total can’t: whether the plug-in hybrid — a car with a cord and a petrol engine, sold for a decade as the bridge to the electric one — turned out to be a bridge or a dead end. The two slopes are not close, and they have not been converging.
Registrations in force, not sales: a stock that grows with purchases and shrinks as cars leave the road or the state, so a month that dips is not a month nobody bought one. Counted at the owner’s registration address.
Source: Washington State Department of Licensing, Electric Vehicle Population Size History By County, via data.wa.gov 3d5d-sdqb, statewide registrations in force. Bench post — generated from the latest observation in the site database.
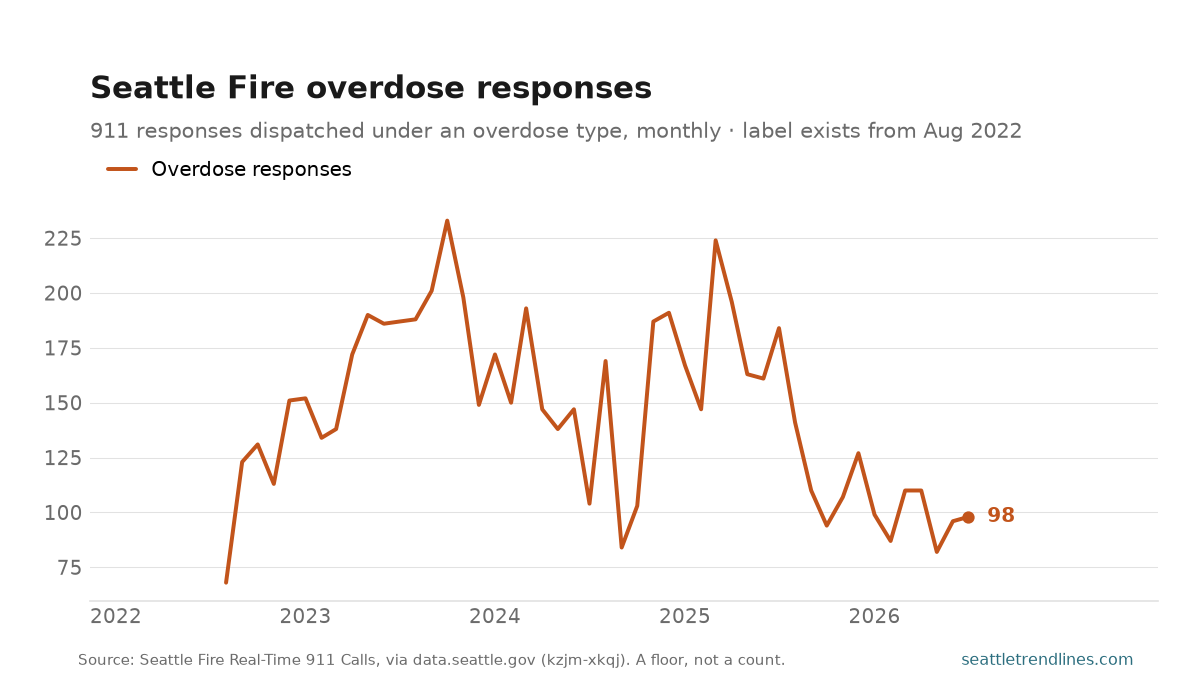
Seattle Fire was dispatched to 98 overdose calls in July 2026, down 46.7% from a year earlier. Over the life of the series the monthly count has run between 68 (August 2022) and 233 (October 2023).
This is the timely companion to the overdose death count, and it is a different measurement in every respect. Deaths are certified by the Medical Examiner and arrive as an annual figure a year late; these are dispatches, and they land the same day. Most of them are survivals — a response is a call for help, and the great majority of people the medics reach do not die. So the two lines answer different questions: one counts the worst outcome, this one counts how often the emergency happens at all.
Two limits, and both matter. The chart starts in August 2022 because that is when an overdose dispatch type first appears in the feed — the flat run of zeros before it is a missing label, not a city without overdoses, and it is why there is no pre-fentanyl baseline here to compare against. And the cut is a substring match on free text, which the department writes inconsistently (‘Medic Response-Overdose’, ‘BC Med Response Overdose’), so it is a floor: an overdose dispatched as an unconscious person, or a cardiac arrest, is not in it.
Source: Seattle Fire Department, Real-Time 911 Calls, via data.seattle.gov (Socrata kzjm-xkqj), responses whose free-text dispatch type contains OVERDOSE. A floor on overdose responses rather than an exact count. Auto-generated each build.
What’s coming on seattletrendlines.com the week of August 17–21 — 10 posts, two a day, every weekday.
Monday, August 17 — Battery or hybrid: Washington’s EV mix, July 2026; Seattle Fire overdose responses, July 2026.
Tuesday, August 18 — What the Seattle metro economy is worth, 2023; Seattle gas prices in real terms, July 2026.
Wednesday, August 19 — The crime category that isn’t one, June 2026; Seattle inflation against the country, June 2026.
Thursday, August 20 — Washington jobless claims, week of Aug 8, 2026; What King County sellers put up, July 2026.
Friday, August 21 — What King County sellers are asking, July 2026; Primary election turnout, King County (pending — its numbers haven’t landed yet).
This is the plan, not a promise. Every weekday post here is tied to a data release, and a release that slips takes its post with it — the post simply waits for the day its numbers land. A figure that arrives early, a revision worth writing about, or an unexpected story out of Seattle can just as easily add a post that isn’t on this list. Expect the week to look roughly like this, and expect at least one day of it not to.
The week of August 10–14 on seattletrendlines.com, in 7 posts.
Tuesday, August 11 — How long a King County listing sits, July 2026. The median King County listing sat 44 days on the market in July 2026, up 2 days from a year earlier.
Tuesday, August 11 — The shrinking factory floor, June 2026. Seattle-metro factories employed 166,700 people in June 2026, up 2.0% from a year earlier. The high-water mark was 246,000 in June 1998 — this region now has 79,800 fewer manufacturing jobs than it did then, a fall of 32%.
Wednesday, August 12 — The construction cycle, June 2026. The Seattle metro’s construction trades employed 121,900 people in June 2026, down 1.1% from a year earlier.
Wednesday, August 12 — Washington business applications, June 2026. Washingtonians filed 9,333 new business applications in June 2026, up 9.0% from a year earlier.
Thursday, August 13 — Restaurants, hotels and the long climb back, June 2026. Seattle-metro restaurants, bars, hotels and venues employed 212,600 people in June 2026, up 1.4% from a year earlier.
Thursday, August 13 — The permit numbers nobody should read, June 2026. The Seattle metro permitted 1,947 housing units in June 2026, against 2,263 the month before. Do not read anything into that.
Friday, August 14 — What a Seattle dollar is worth, April 2026. The Seattle-area consumer price index stood at 377.1 in April 2026. The index itself is not the interesting number — what it means is.
The week in review: every post from August 10–14, summarised from its own listing blurb and linked. Assembled each Saturday from the posts that actually published that week.