The permit numbers nobody should read, June 2026
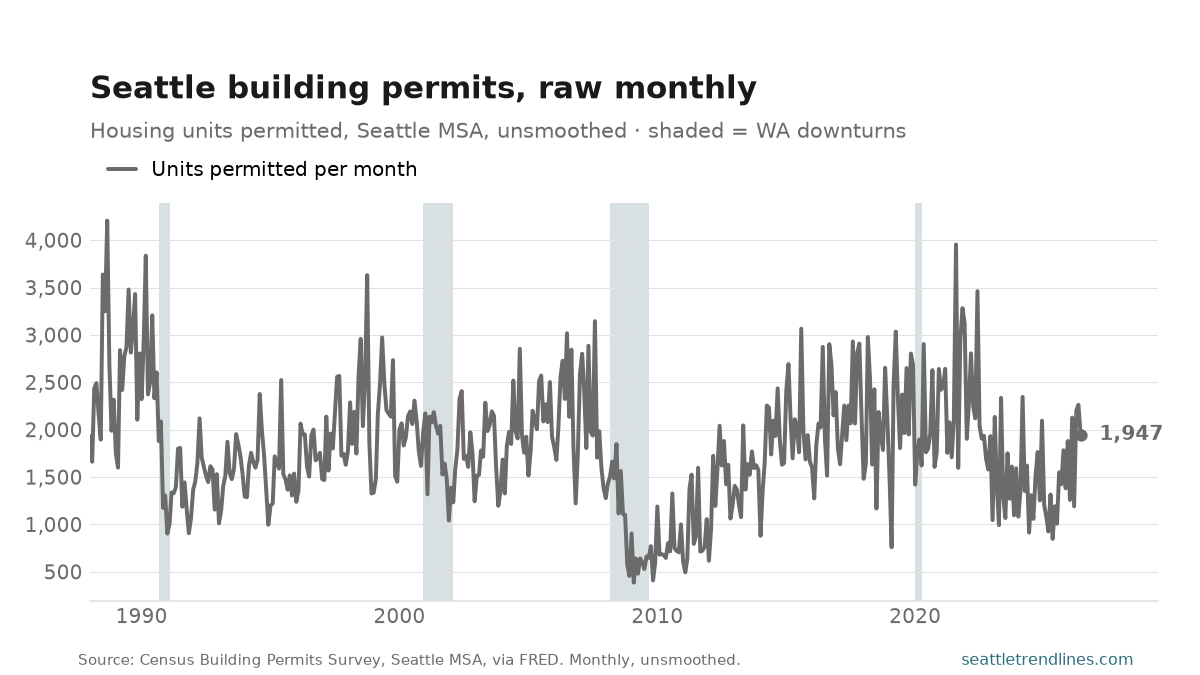
The Seattle metro permitted 1,947 housing units in June 2026, against 2,263 the month before. Do not read anything into that.
This is the raw monthly permit count, and it is here as a demonstration rather than as news. The series swings between 386 units (February 2009) and 4,207 (September 1988), and month-to-month moves of a third in either direction are routine — one 300-unit apartment building crossing a desk on the 31st rather than the 1st shows up here as a boom or a collapse. A single large project can be most of a month’s number.
That is why every permit post on this site charts the trailing 12-month sum instead: the permit slump is the same data with a year of it added up, and it has a shape you can actually read. The smoothing is not a cosmetic choice. It is the difference between a series that means something and this one.
Source: U.S. Census Bureau Building Permits Survey, Seattle–Tacoma–Bellevue MSA, housing units permitted per month, not smoothed and not seasonally adjusted, via FRED. Bench post — generated from the latest observation in the site database.