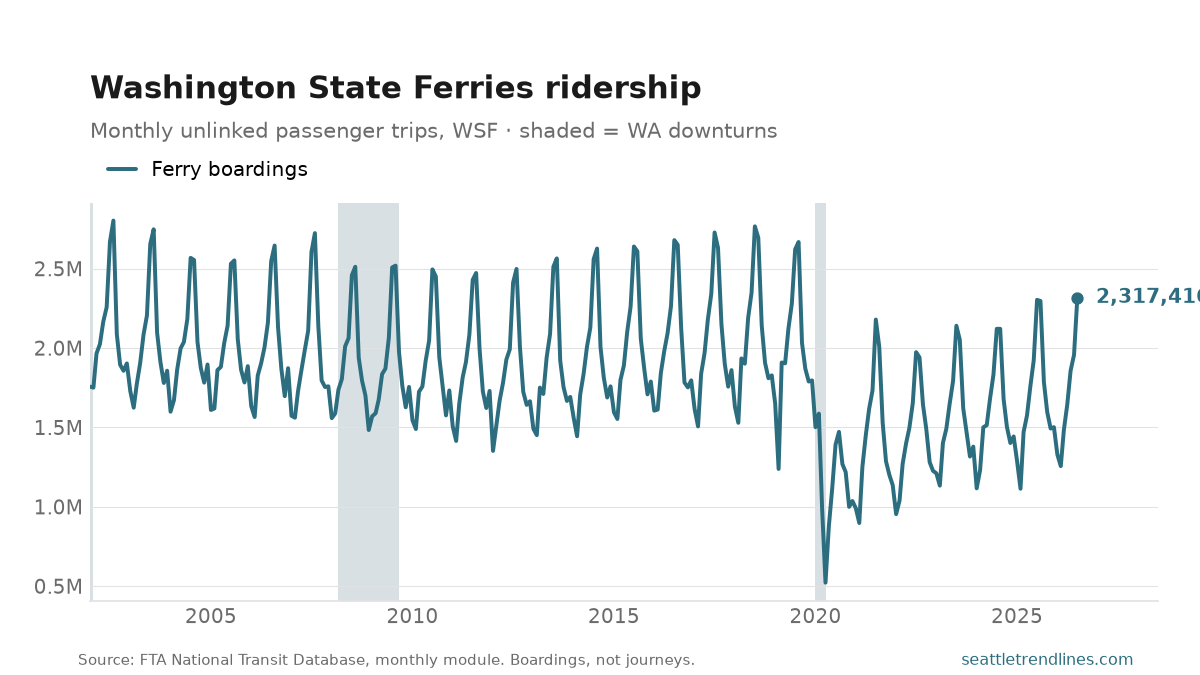
Washington State Ferries carried 2,317,416 passengers in July 2026, up 0.6% from a year earlier. The system swings hard with the season — from 522,473 in April 2020 to 2,803,031 in August 2002 — so the year-over-year figure is the one that means anything.
It is the largest ferry system in the United States and, unlike every other service charted here, it is simultaneously a commuter railway and a tourist attraction: the winter floor is people going to work on Bainbridge and Vashon, and the summer peak is everyone else. That is what makes the seasonal amplitude worth watching in its own right — a summer that runs below the usual multiple of its winter is a tourism signal, not a commuting one.
The constraint on this system is increasingly boats and crews rather than demand: sailings have been cancelled or reduced in recent years for vessel availability and staffing, and a cancelled sailing shows up here as fewer riders. Read a fall as service before reading it as demand. Boardings, not journeys; not seasonally adjusted.
Source: Federal Transit Administration, National Transit Database monthly module, Washington State Ferries unlinked passenger trips. Auto-generated each build.
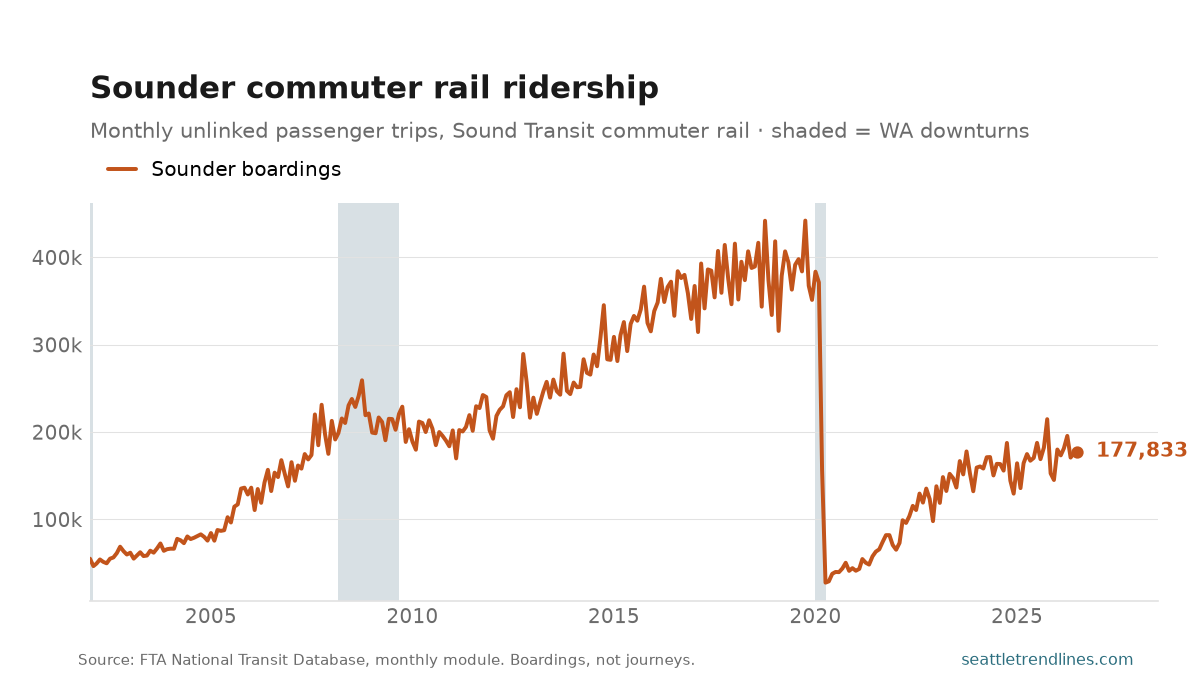
Sounder carried 177,833 boardings in July 2026, down 5.3% on the year — against a peak of 442,159 in October 2019, which makes it 60% below its high-water mark.
Sounder is the purest commuter service in the region and therefore the most exposed to remote work. It runs peak-direction trains on weekday mornings and evenings between Everett, Seattle and Lakewood, and almost nothing else — so unlike the bus or Link, it has essentially no non-commute ridership to cushion it. If you want a single number for how much the downtown office day has come back, this is the least ambiguous one on this site.
Boardings, not journeys. Service levels have changed over the period — trips added and, on the north line, cancelled for mudslides — so a fall is not always a fall in demand. Not seasonally adjusted.
Source: Federal Transit Administration, National Transit Database monthly module, Sound Transit commuter rail unlinked passenger trips. Auto-generated each build.
What’s coming on seattletrendlines.com the week of September 14–18 — 13 posts on the calendar.
Monday, September 14 — Sounder commuter rail, July 2026; Washington State Ferries ridership, July 2026.
Tuesday, September 15 — Seattle’s crime rate, July 2026; Seattle’s crimes against society, July 2026.
Wednesday, September 16 — Washington business applications, August 2026; How educated King County is, 2024 (pending — its numbers haven’t landed yet); Seattle gas prices, August 2026.
Thursday, September 17 — Working from home in King County, 2024 (pending — its numbers haven’t landed yet); Seattle inflation against the country, August 2026; Seattle gas in today’s dollars, August 2026.
Friday, September 18 — Buy or rent: the Seattle ratio, August 2026; King County’s changing population, 2024 (pending — its numbers haven’t landed yet); Seattle asking rents, August 2026.
This is the plan, not a promise. Every weekday post here is tied to a data release, and a release that slips takes its post with it — the post simply waits for the day its numbers land. A figure that arrives early, a revision worth writing about, or an unexpected story out of Seattle can just as easily add a post that isn’t on this list. Expect the week to look roughly like this, and expect at least one day of it not to.
The week of September 7–11 on seattletrendlines.com, in 9 posts.
Monday, September 7 — King County asking prices, August 2026. The median King County listing asked $849,000 in August 2026, down 1.3% from a year earlier.
Monday, September 7 — King County homes under contract, August 2026. 1,969 King County listings were under contract at the end of August 2026, down 17.0% from a year earlier.
Tuesday, September 8 — How long a King County listing sits, August 2026. The median King County listing sat 45 days on the market in August 2026, against 45 days a year earlier.
Tuesday, September 8 — Seattle-metro unemployment, July 2026. Seattle-metro unemployment was 5.0% in July 2026, the newest month in the series and the monthly update to the unemployment post. That is up 0.4 points from 4.6% in the same month a year earlier, and unchanged the month before.
Wednesday, September 9 — Link light rail ridership, July 2026. Link carried 5,205,705 boardings in July 2026, up 41.8% from a year earlier. The record month is 5,205,705 (July 2026); today’s figure is 0% above it.
Wednesday, September 9 — Seattle’s labor force, July 2026. The Seattle–Tacoma–Bellevue labor force — everyone employed or actively looking for work — was 2,296,029 in July 2026, down 0.7% from a year earlier.
Thursday, September 10 — King County Metro bus ridership, July 2026. King County Metro carried 7,757,126 bus boardings in July 2026, up 0.2% on the year. The peak in this series is 11,328,648 (October 2019), which puts the latest month 32% below it.
Friday, September 11 — Seattle offences against persons, July 2026. Seattle police recorded 1,119 offences against persons in July 2026, down 4.4% from a year earlier.
Friday, September 11 — Seattle offences against property, July 2026. Seattle police recorded 3,787 offences against property in July 2026, down 7.6% from a year earlier.
The week in review: every post from September 7–11, summarised from its own listing blurb and linked. Assembled each Saturday from the posts that actually published that week.
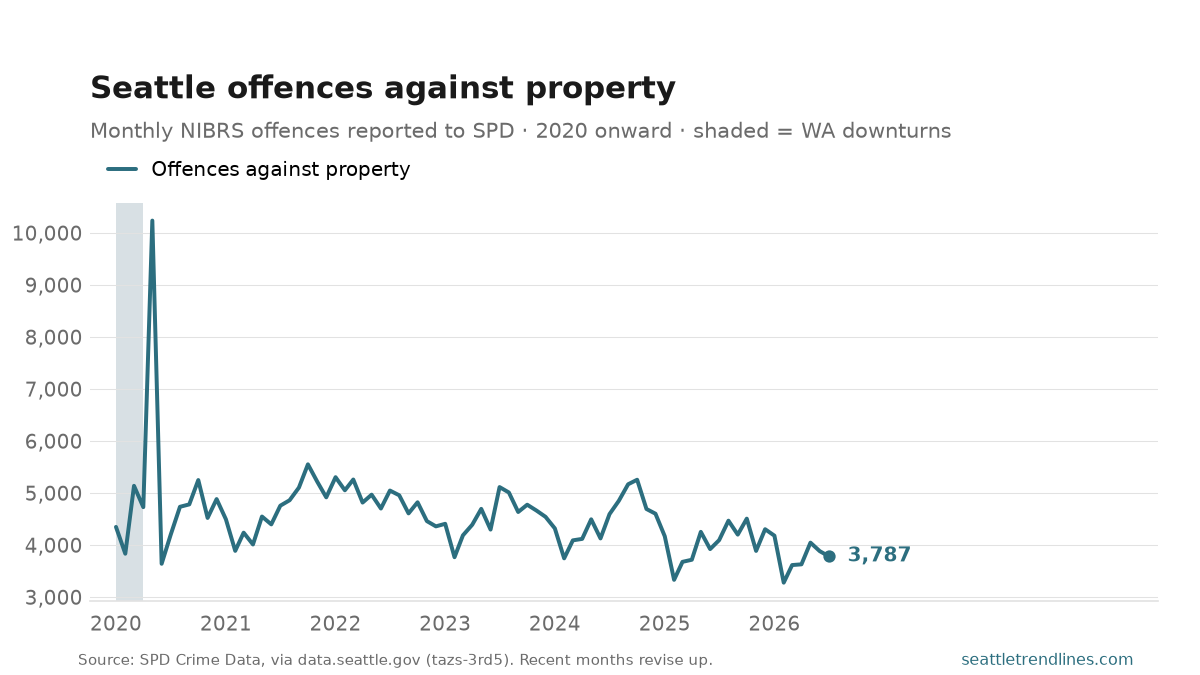
Seattle police recorded 3,787 offences against property in July 2026, down 7.6% from a year earlier. This is the bulk of reported crime in the city — burglary, car prowls, vehicle theft, shoplifting — and when a single ‘crime is up’ figure is quoted anywhere, this category is most of what moved it.
The one-month spike in May 2020 is the night of widespread downtown break-ins during the George Floyd protests. It is one event and it is left in the chart rather than smoothed away.
As always: reported crime, offences rather than incidents, and recent months revise upward. The chart starts in 2020 because of SPD’s 2019 records-system change.
Source: Seattle Police Department, SPD Crime Data 2008-Present, via data.seattle.gov (Socrata tazs-3rd5), NIBRS crimes-against-property category. Auto-generated each build.
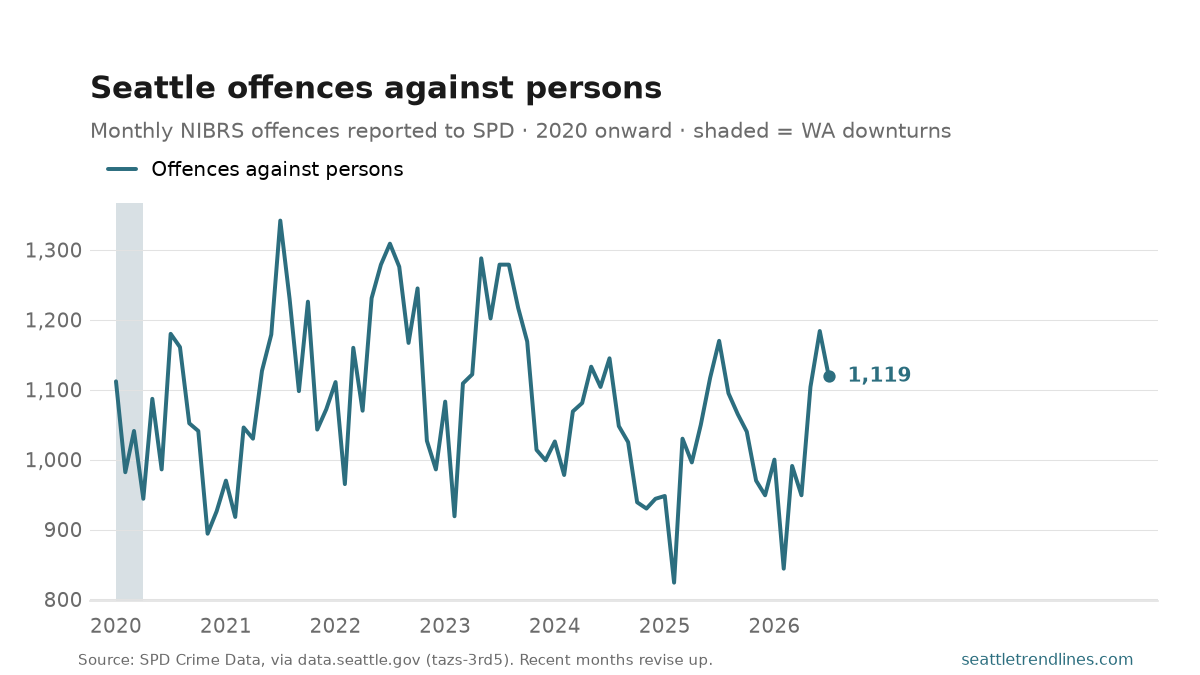
Seattle police recorded 1,119 offences against persons in July 2026, down 4.4% from a year earlier. This is the assault, robbery and homicide category — the offences with a victim who was there — and it is the one worth watching on its own rather than inside a combined crime total, where property offences outnumber it three to one and drown it out.
Three caveats carry every month. This counts crime reported to police, so it moves with reporting behaviour as well as with crime. It counts offences, not incidents. And recent months revise upward as late reports land, so the right-hand edge is provisional. For the same number with the city’s growth divided out, see the crime rate post. The chart starts in 2020 because SPD changed records systems in 2019 and the counts either side are not comparable.
Source: Seattle Police Department, SPD Crime Data 2008-Present, via data.seattle.gov (Socrata tazs-3rd5), NIBRS crimes-against-persons category. Auto-generated each build.
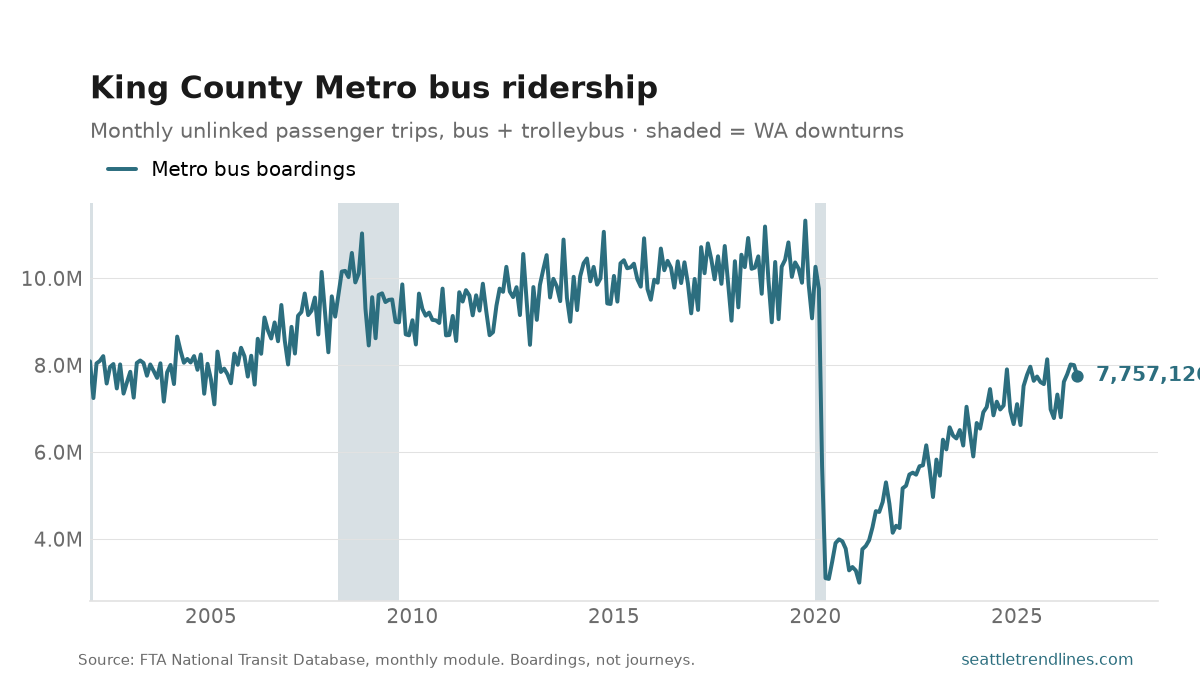
King County Metro carried 7,757,126 bus boardings in July 2026, up 0.2% on the year. The peak in this series is 11,328,648 (October 2019), which puts the latest month 32% below it.
The bus is the part of the transit system that mostly does not get written about, and it carries far more people than the train does. It is also the better economic indicator of the two: the bus network has not changed shape the way the rail network has, so its ridership moves with commuting, employment and the cost of driving rather than with construction schedules. The gap between the bus line and the rail line since 2020 is the clearest picture available of how office work changed in this region.
Trolleybus routes are included with the diesel and hybrid fleet — they are one network to a rider and splitting them would chart the vehicle procurement rather than the travel. Boardings, not journeys: a trip with a transfer counts twice. Not seasonally adjusted, so compare with the same month a year earlier.
Source: Federal Transit Administration, National Transit Database monthly module, King County Metro motorbus and trolleybus unlinked passenger trips. Auto-generated each build.
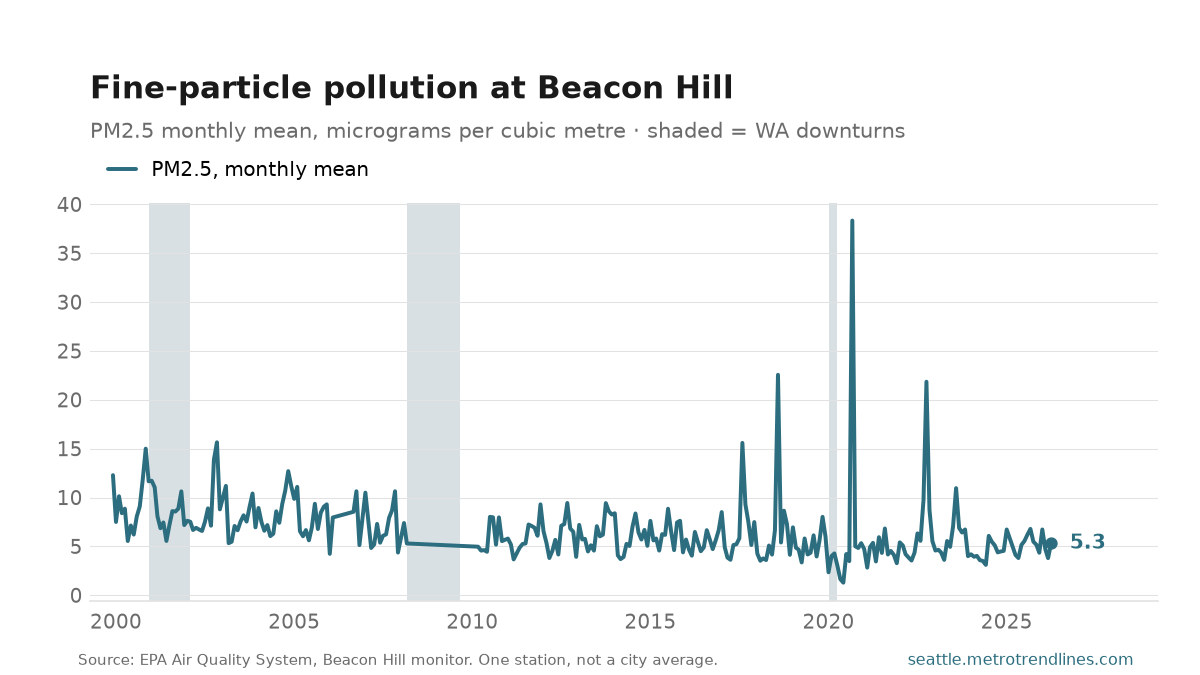
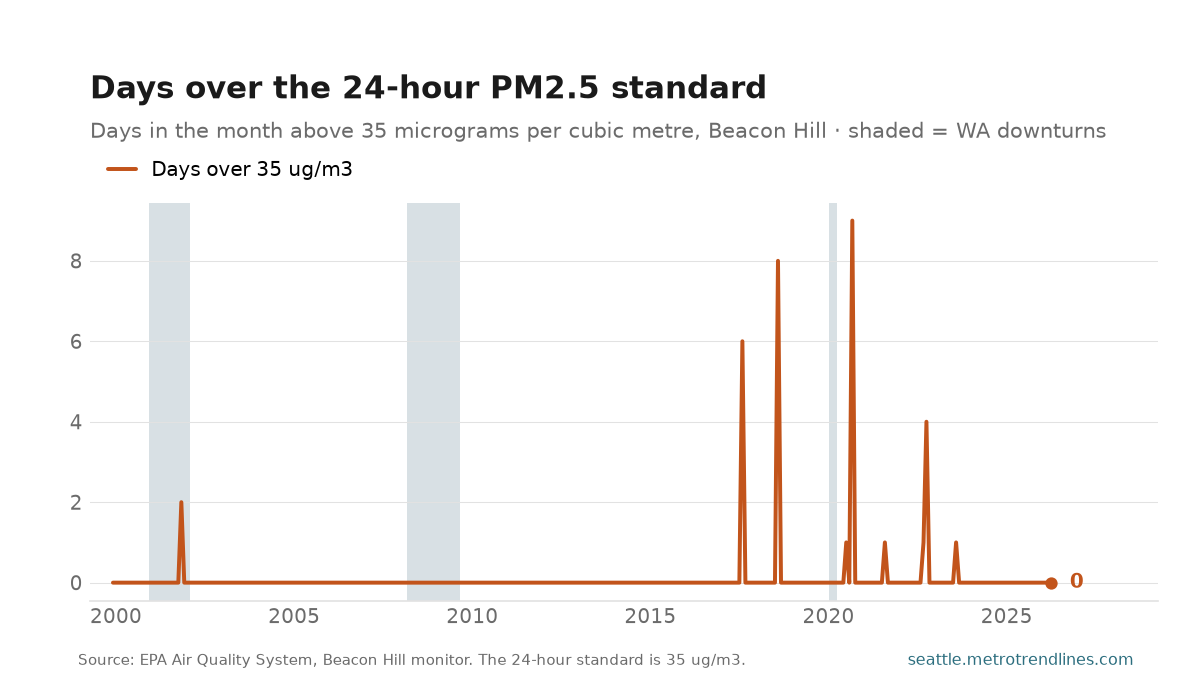
Fine particles at the Beacon Hill monitor averaged 5.3 micrograms per cubic metre in April 2026, up 28.6% from a year earlier. No day in the month went over the 24-hour standard of 35.
The monthly mean is the wrong statistic for smoke, which is why the day count sits beside it. Wildfire smoke arrives as a handful of genuinely dangerous days, and a month with four unbreathable days and twenty-six clean ones averages out to something unremarkable. The mean is the right measure of the ordinary background — traffic, wood stoves, industry — and that background has been falling for two decades. The days-over-35 count is the measure of the thing that actually sends people indoors.
Beacon Hill is one monitor and Seattle is not uniform: a site beside a freeway reads higher and a waterfront site lower on the same day. What one long-running station buys instead is comparability — the record reaches back to December 1999 at the same place, so the trend is real even where the level is local. The record month is 38 in September 2020.
Source: U.S. Environmental Protection Agency, Air Quality System, Beacon Hill monitor (site 53-033-0080), monthly mean PM2.5 and the count of days above the 35 ug/m3 24-hour standard. One monitor, not a citywide average. Auto-generated each build.
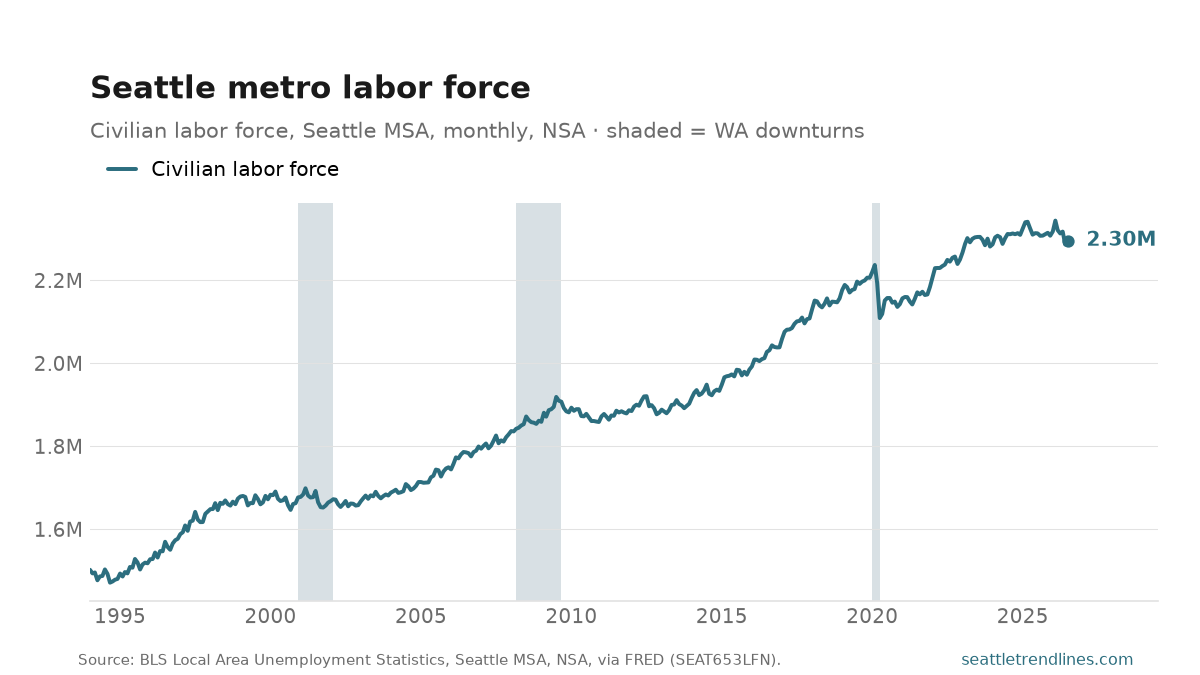
The Seattle–Tacoma–Bellevue labor force — everyone employed or actively looking for work — was 2,296,029 in July 2026, down 0.7% from a year earlier. It’s the head-count denominator under the unemployment rate: a labor force that grows with population and participation. Not seasonally adjusted.
Source: U.S. Bureau of Labor Statistics, Local Area Unemployment Statistics, Seattle–Tacoma–Bellevue MSA civilian labor force, not seasonally adjusted, via FRED SEAT653LFN. Auto-generated each build.
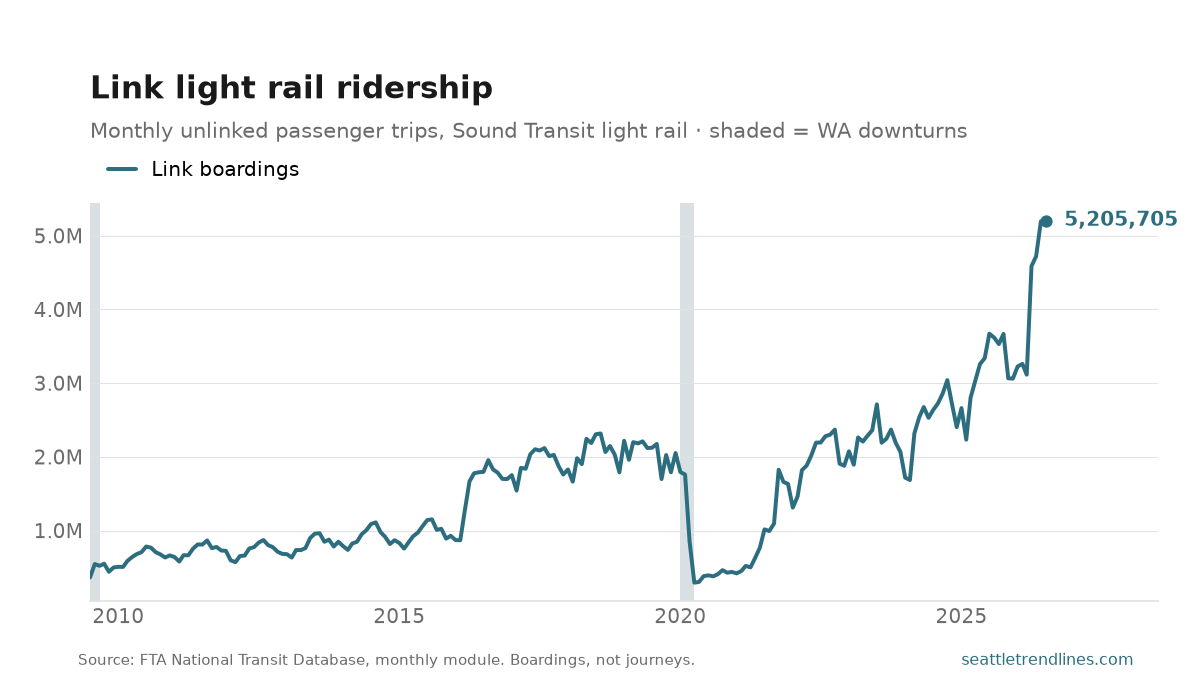
Link carried 5,205,705 boardings in July 2026, up 41.8% from a year earlier. The record month is 5,205,705 (July 2026); today’s figure is 0% above it.
Link is the one Seattle transit number that is not really about the economy: the line keeps getting longer. Extensions to Northgate, the Eastside and Lynnwood each added stations and riders, so a rise here is partly more people riding and partly more railway to ride — which is why the year-over-year comparison matters more than the level, and why a step up in the line usually has an opening date behind it rather than a change in behaviour.
These are boardings, not journeys or people. A trip with a transfer counts twice, so a network that adds a transfer point reports more ridership from the same riders. The figures are Sound Transit’s own submissions to the federal National Transit Database, which is what makes them comparable with the bus and ferry numbers here; the agency’s public tracker uses a slightly different basis and will not always match. Not seasonally adjusted.
The chart starts at the July 2009 opening of Central Link. Sound Transit reported light-rail boardings to the NTD for six years before that, but they are Tacoma’s line — a separate 1.6-mile route at the other end of the corridor, running in the tens of thousands a month — and drawn beside Seattle’s millions they would read as a railway that did not exist yet.
Source: Federal Transit Administration, National Transit Database monthly module, Sound Transit light rail unlinked passenger trips, from the July 2009 opening of Central Link. Auto-generated each build.