What moves through the gateway, 2025
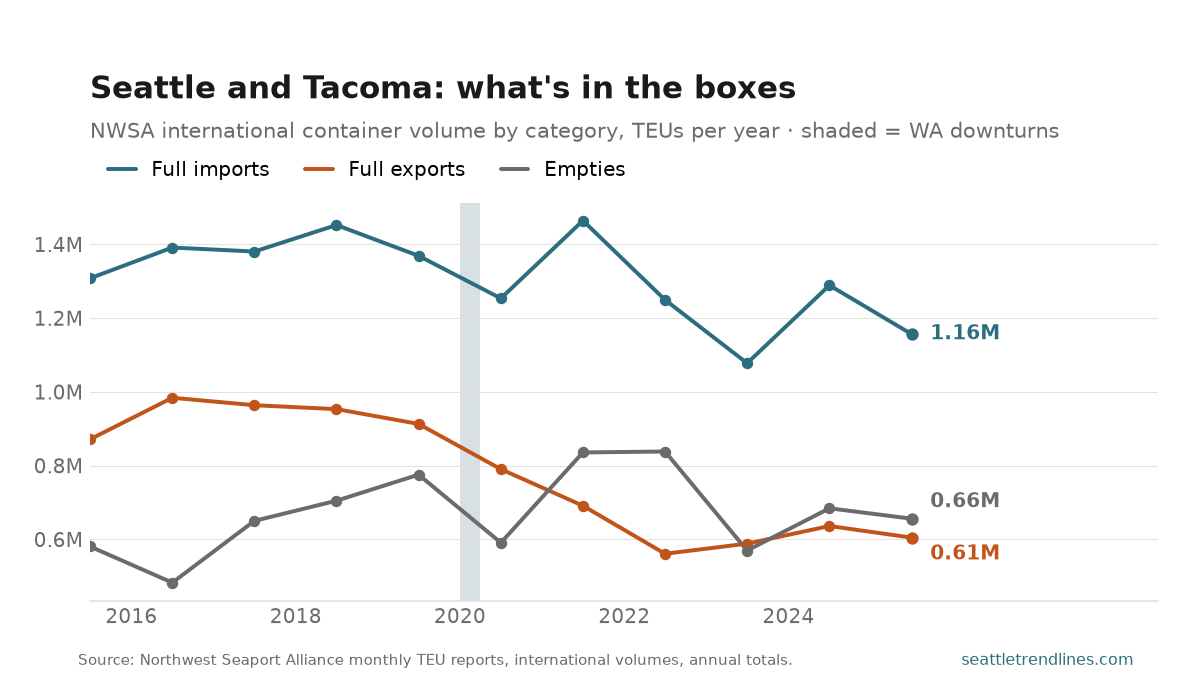
The Northwest Seaport Alliance moved 1,157,002 TEUs of full imports in 2025, down 10.3% on the year, against 605,126 TEUs of full exports and 656,406 TEUs of empty boxes.
The headline container number adds those together, and in doing so hides the thing worth knowing: for every container of goods leaving Seattle and Tacoma, roughly 1.9 arrive. The balance did not use to be that lopsided. Exports have fallen while imports have held, and the difference has to sail back out as air — which is why the empties line matters. An empty container is a paid movement of nothing, and its share of the total is a direct measure of how one-directional this gateway has become.
International volumes only, so the Alaska and Hawai’i domestic trades are excluded. TEUs count boxes rather than value, so a container of aircraft parts and a container of hay weigh the same here. Annual figures — the Alliance reports monthly, but only the year totals are wired into this site.
Source: Northwest Seaport Alliance container volume reports, international full imports, full exports and empty containers, annual totals in TEUs. Auto-generated each build.